

How can starlight reveal a distant planet’s atmosphere?
Follow the light Ariel will measure, then compare a real Webb spectrum with two competing explanations.
A planet changes the light that reaches us
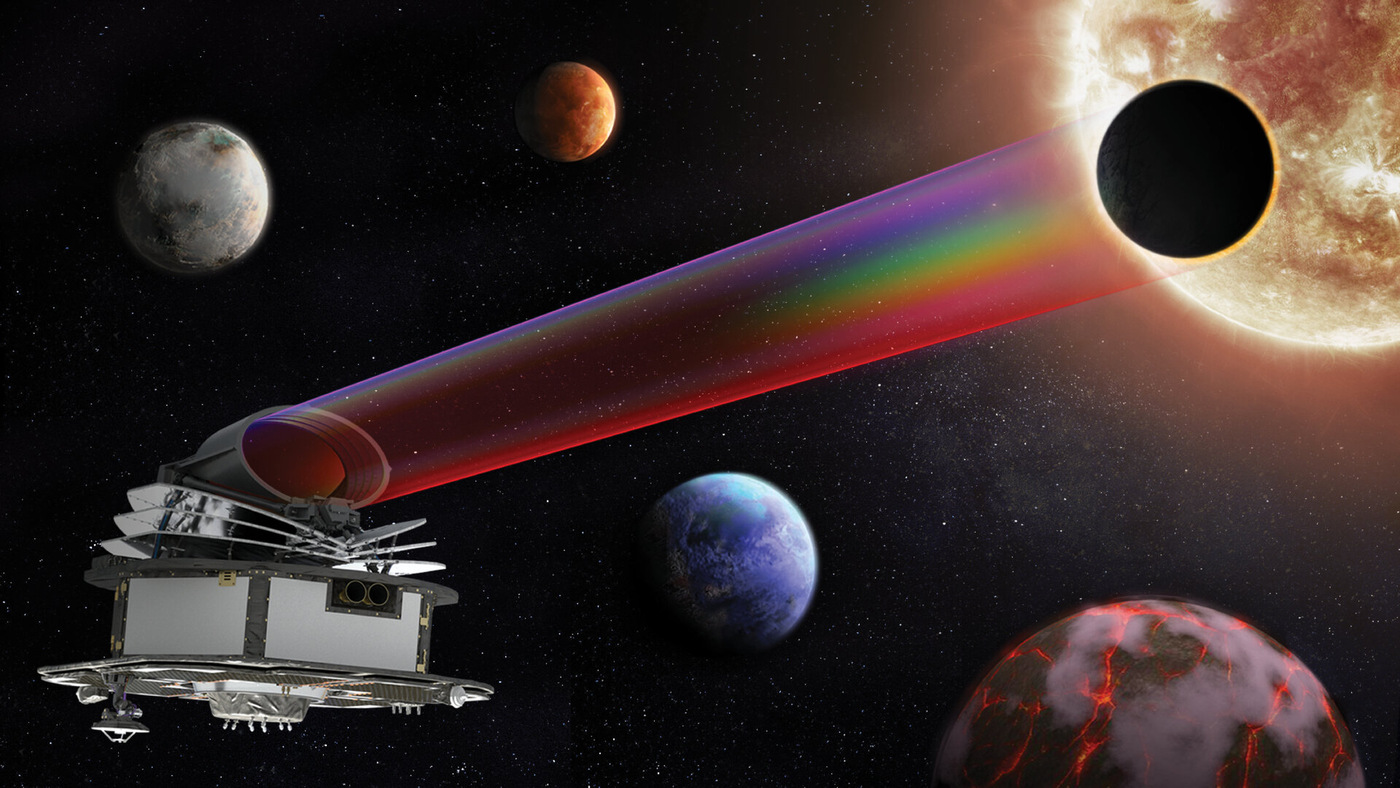
ESA’s future Ariel mission is designed to study the atmospheres of about a thousand planets around other stars. Its telescope will collect light from systems in which the star and planet are too far away to resemble the nearby worlds in a spacecraft photograph. How can that light reveal what surrounds a planet? [1] [6]
The useful clue is a small change as a planet moves across its star. Most of the stellar disk remains visible. The planet blocks part of it, while a smaller contribution to the light can pass through the thin atmospheric rim. That extra path allows the atmosphere to leave a wavelength-dependent signature. [2]
First measure what changed
A transit makes the combined system dimmer. That broad dip establishes that something crossed the star; an atmospheric measurement asks a more specific question. Does the amount of dimming depend on wavelength? Astronomers compare observations of the same system in and out of transit, rather than treating the star’s entire spectrum as a message from the planet. [6] [2]
The star already has its own absorption features. The task is to separate its light from the additional effect associated with the planet’s passage. Accurate timing and a consistent stellar reference matter because the atmospheric contribution sits inside a much larger stellar signal. [2]
Molecules absorb selected wavelengths
Atoms and molecules interact with light differently at different wavelengths. Some parts of the light crossing an atmosphere are absorbed more strongly than others. Splitting the received light into a spectrum makes that pattern measurable, including infrared wavelengths our eyes cannot see. [6] [2]
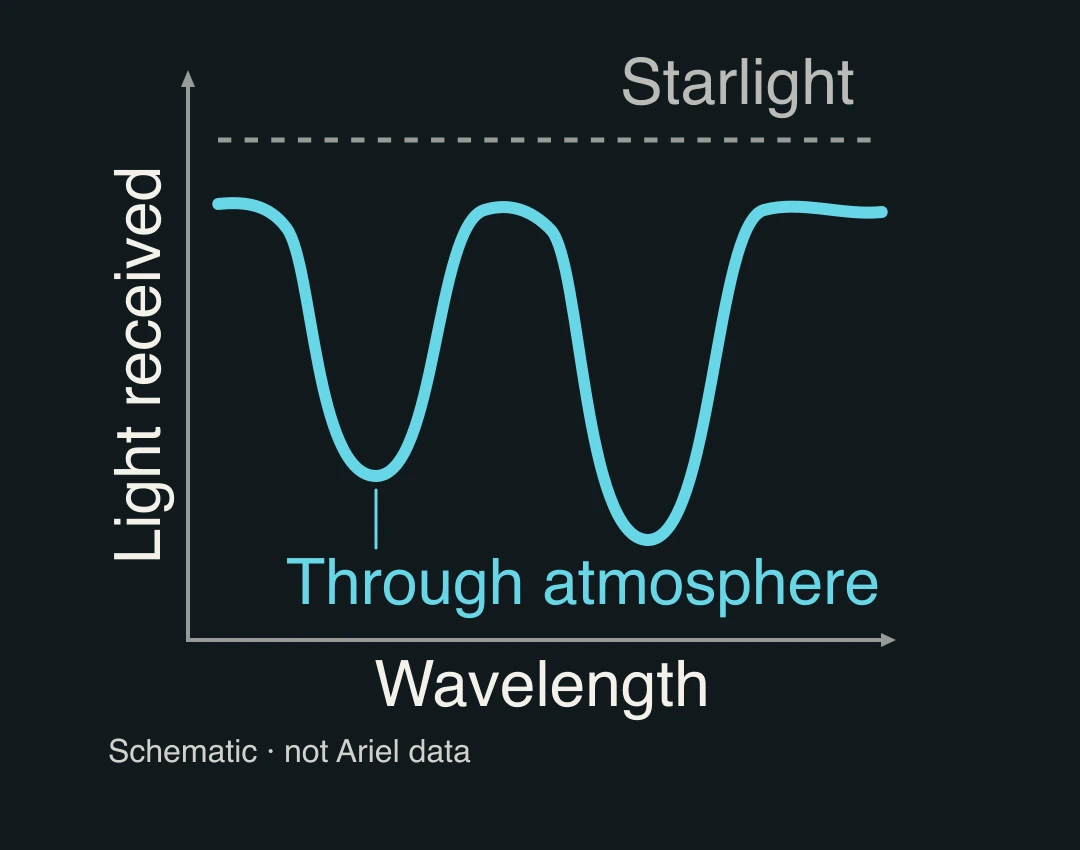
The illustration below follows transmitted light: its cyan curve falls where the atmosphere absorbs more. A transmission-spectrum plot often shows the equivalent effect as extra light blocked during transit, so an absorption feature can point upward on that different vertical axis. Read the axis before interpreting the shape. [6] [5]
A prism turns the question into an instrument
Ariel’s AIRS spectrometer will divide incoming infrared light with prisms and record it in two channels: 1.95–3.9 and 3.9–7.8 micrometres. A separate spectrometer in its Fine Guidance System extends coverage to 1.1–1.95 micrometres. Measuring across several ranges allows a proposed atmospheric explanation to be tested against a pattern, rather than a single promising feature. [3]
Sometimes the water signal belongs to the star
A NASA report published in May 2023 described Webb observations of the rocky planet GJ 486 b. The spectrum showed hints of water vapour, but the team identified two plausible origins: a water-rich planetary atmosphere, or cooler spots on the host star containing water vapour. The planet did not need to cross a visible spot for the star to affect the result. [5]
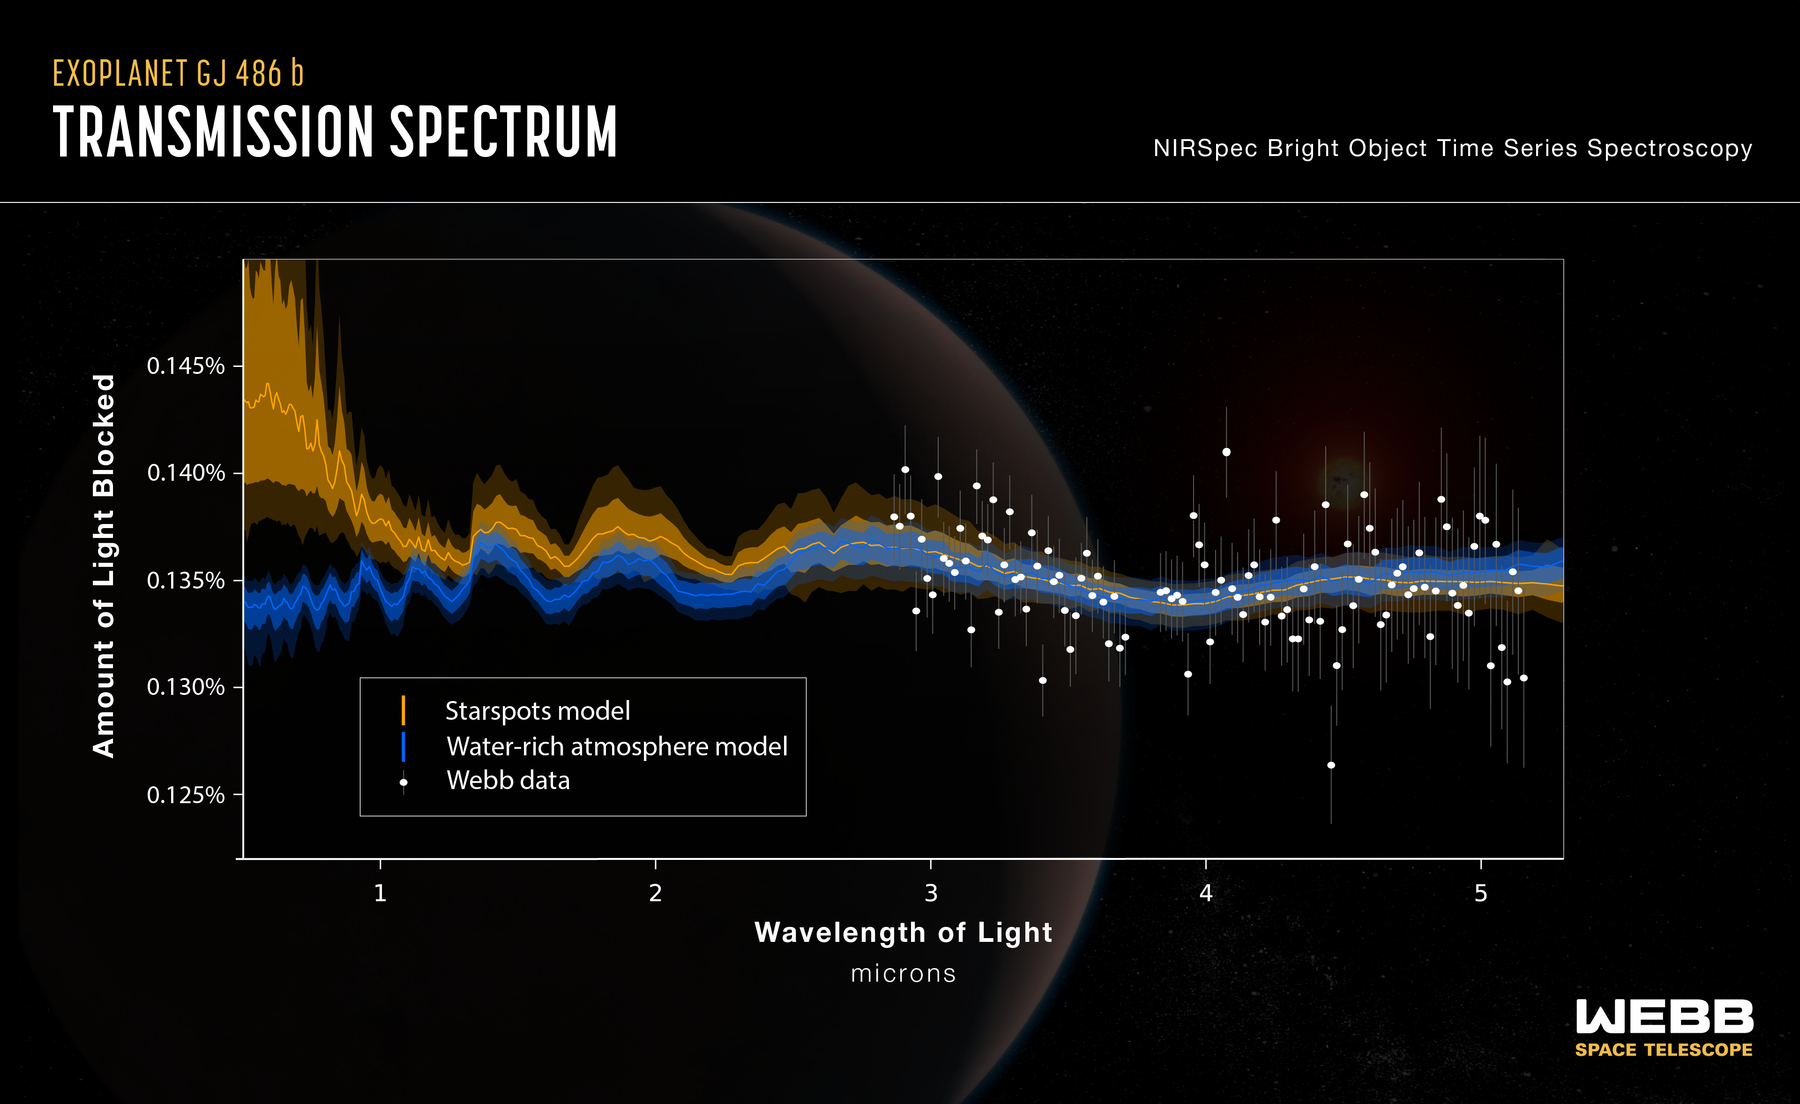
In the published comparison, white points and error bars show the Webb measurements. The blue atmospheric model and yellow starspot model are similar across much of the measured range. Farther left, where the illustrated curves separate more strongly, there are no white data points in this observation. That is a concrete reason to seek measurements that distinguish explanations, rather than choose one from its label. [5]
An atmosphere contains more than its gases
Temperature, clouds and haze also shape the atmosphere Ariel will study. ESA’s science plan includes investigating atmospheric temperature variations and the properties of cloud and haze particles. A chemical interpretation that ignored those other properties would leave out part of the mission’s own scientific question. [4]
Researchers therefore compare atmospheric models and their assumptions with the observations. A preferred composition is an inference supported by that comparison. It becomes more useful when competing explanations make different predictions that further observations can test, as the GJ 486 b example makes visible. [4] [5]
Why observe a population of planets?
Ariel’s survey connects individual spectra to a broader question: how do atmospheres differ across planets and their host stars? Comparing many systems can reveal patterns in composition, temperature and clouds. Repeat observations of selected systems can examine changes over time. The mission is being prepared to make those comparisons; its future survey is not a set of atmospheric results already in hand. [1] [4] [2]
The answer is a tested explanation of a change
Starlight can reveal a distant atmosphere because some of it passes through that atmosphere and changes in a way that depends on wavelength. Spectroscopy measures the pattern. Stellar behaviour, cloud properties and atmospheric models determine how securely we can interpret it. The strongest conclusion is the explanation that survives those comparisons—and a clear account of which observations would separate the remaining possibilities. [2] [4] [5]
Sources & image credits
- ESA · Ariel mission overview ↗
- ESA · Studying exoplanet atmospheres with Ariel ↗
- ESA · Ariel’s instruments ↗
- ESA · Ariel’s three key questions ↗
- NASA · Webb Finds Water Vapor, But From a Rocky Planet or Its Star? · 1 May 2023 ↗
- NASA · How We Find and Classify Exoplanets ↗
- ESA · Ariel key visual · 19 July 2024 ↗
Related reading and objects
How do we find planets we cannot see?
ESA’s PLATO mission will look for planets by measuring changes in the light of their stars. Follow one possible signal from a dark silhouette to a repeatable orbit—and see which questions the dip cannot answer.