

How do we find planets we cannot see?
ESA’s PLATO mission will look for planets by measuring changes in the light of their stars. Follow one possible signal from a dark silhouette to a repeatable orbit—and see which questions the dip cannot answer.
Measure the star before trying to see the planet
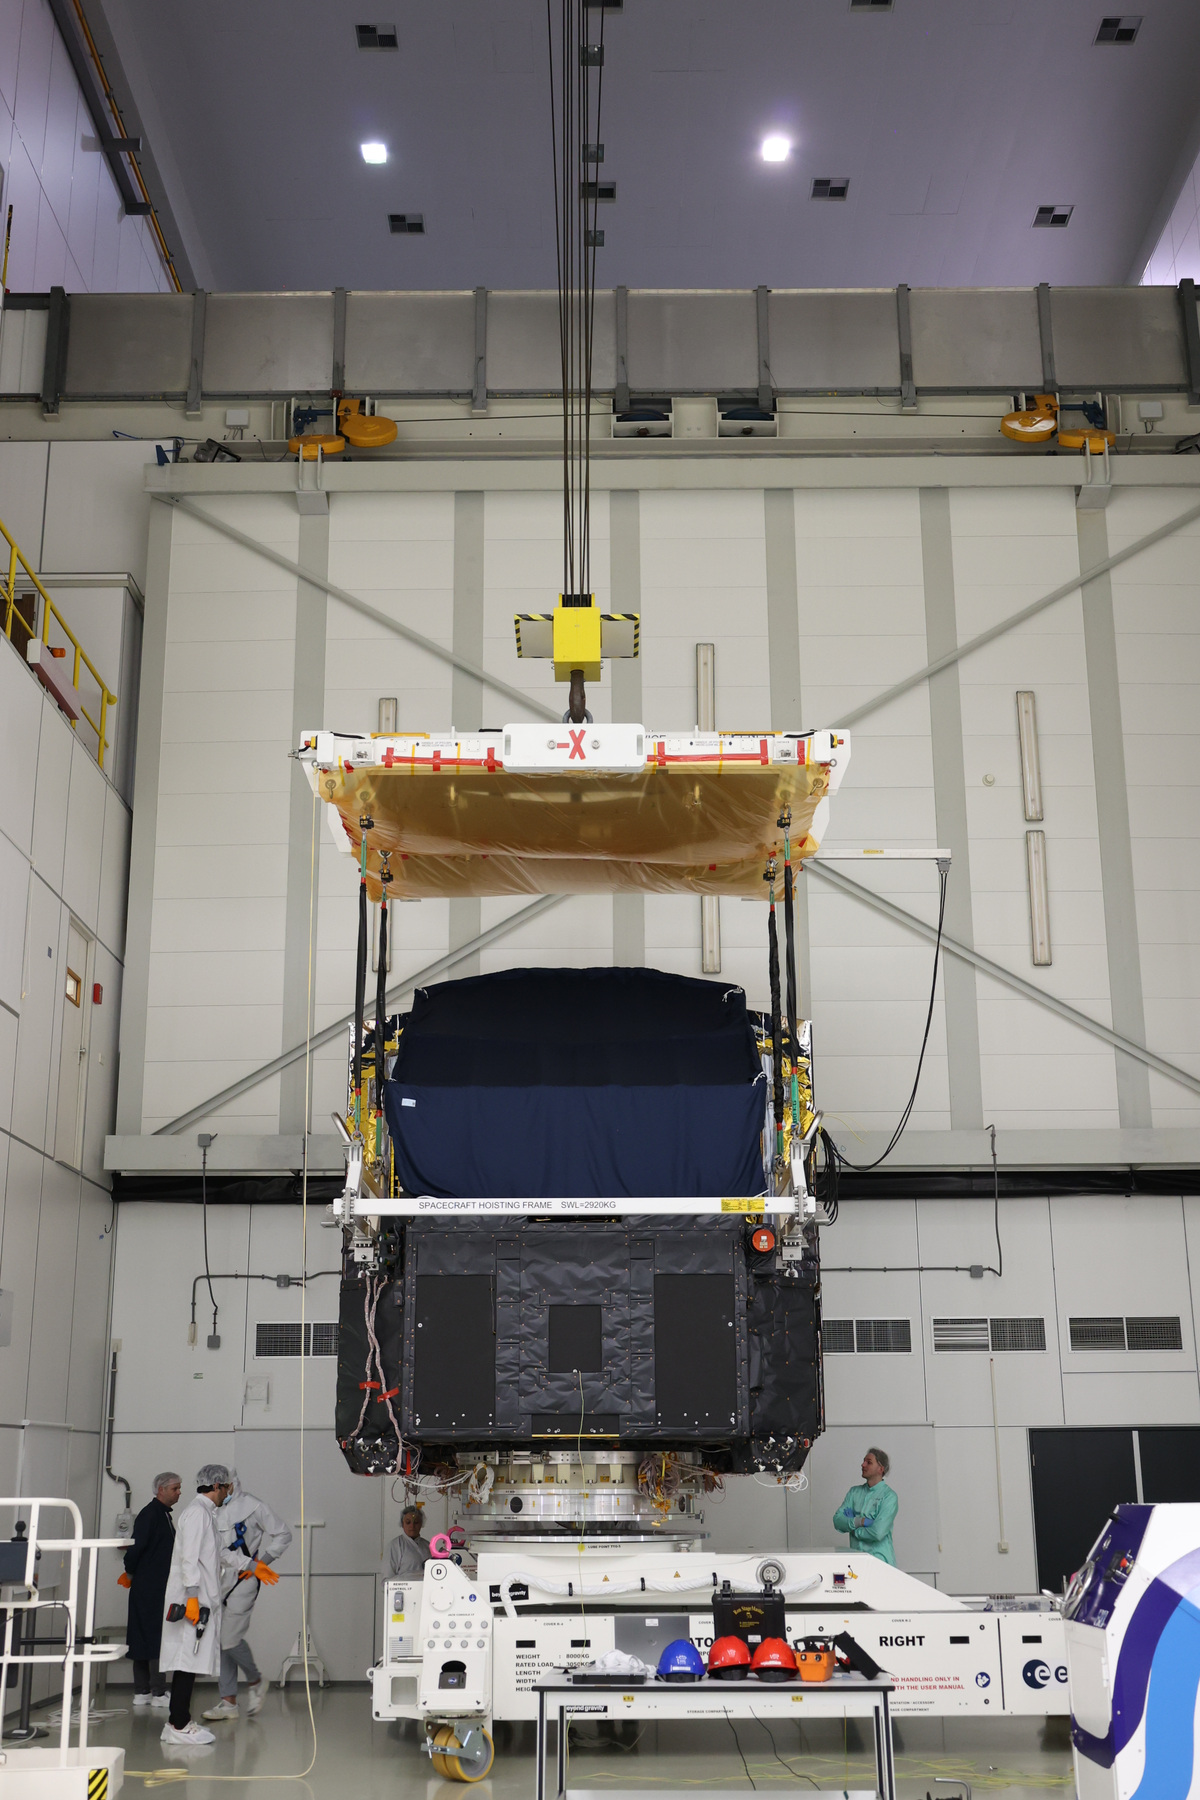
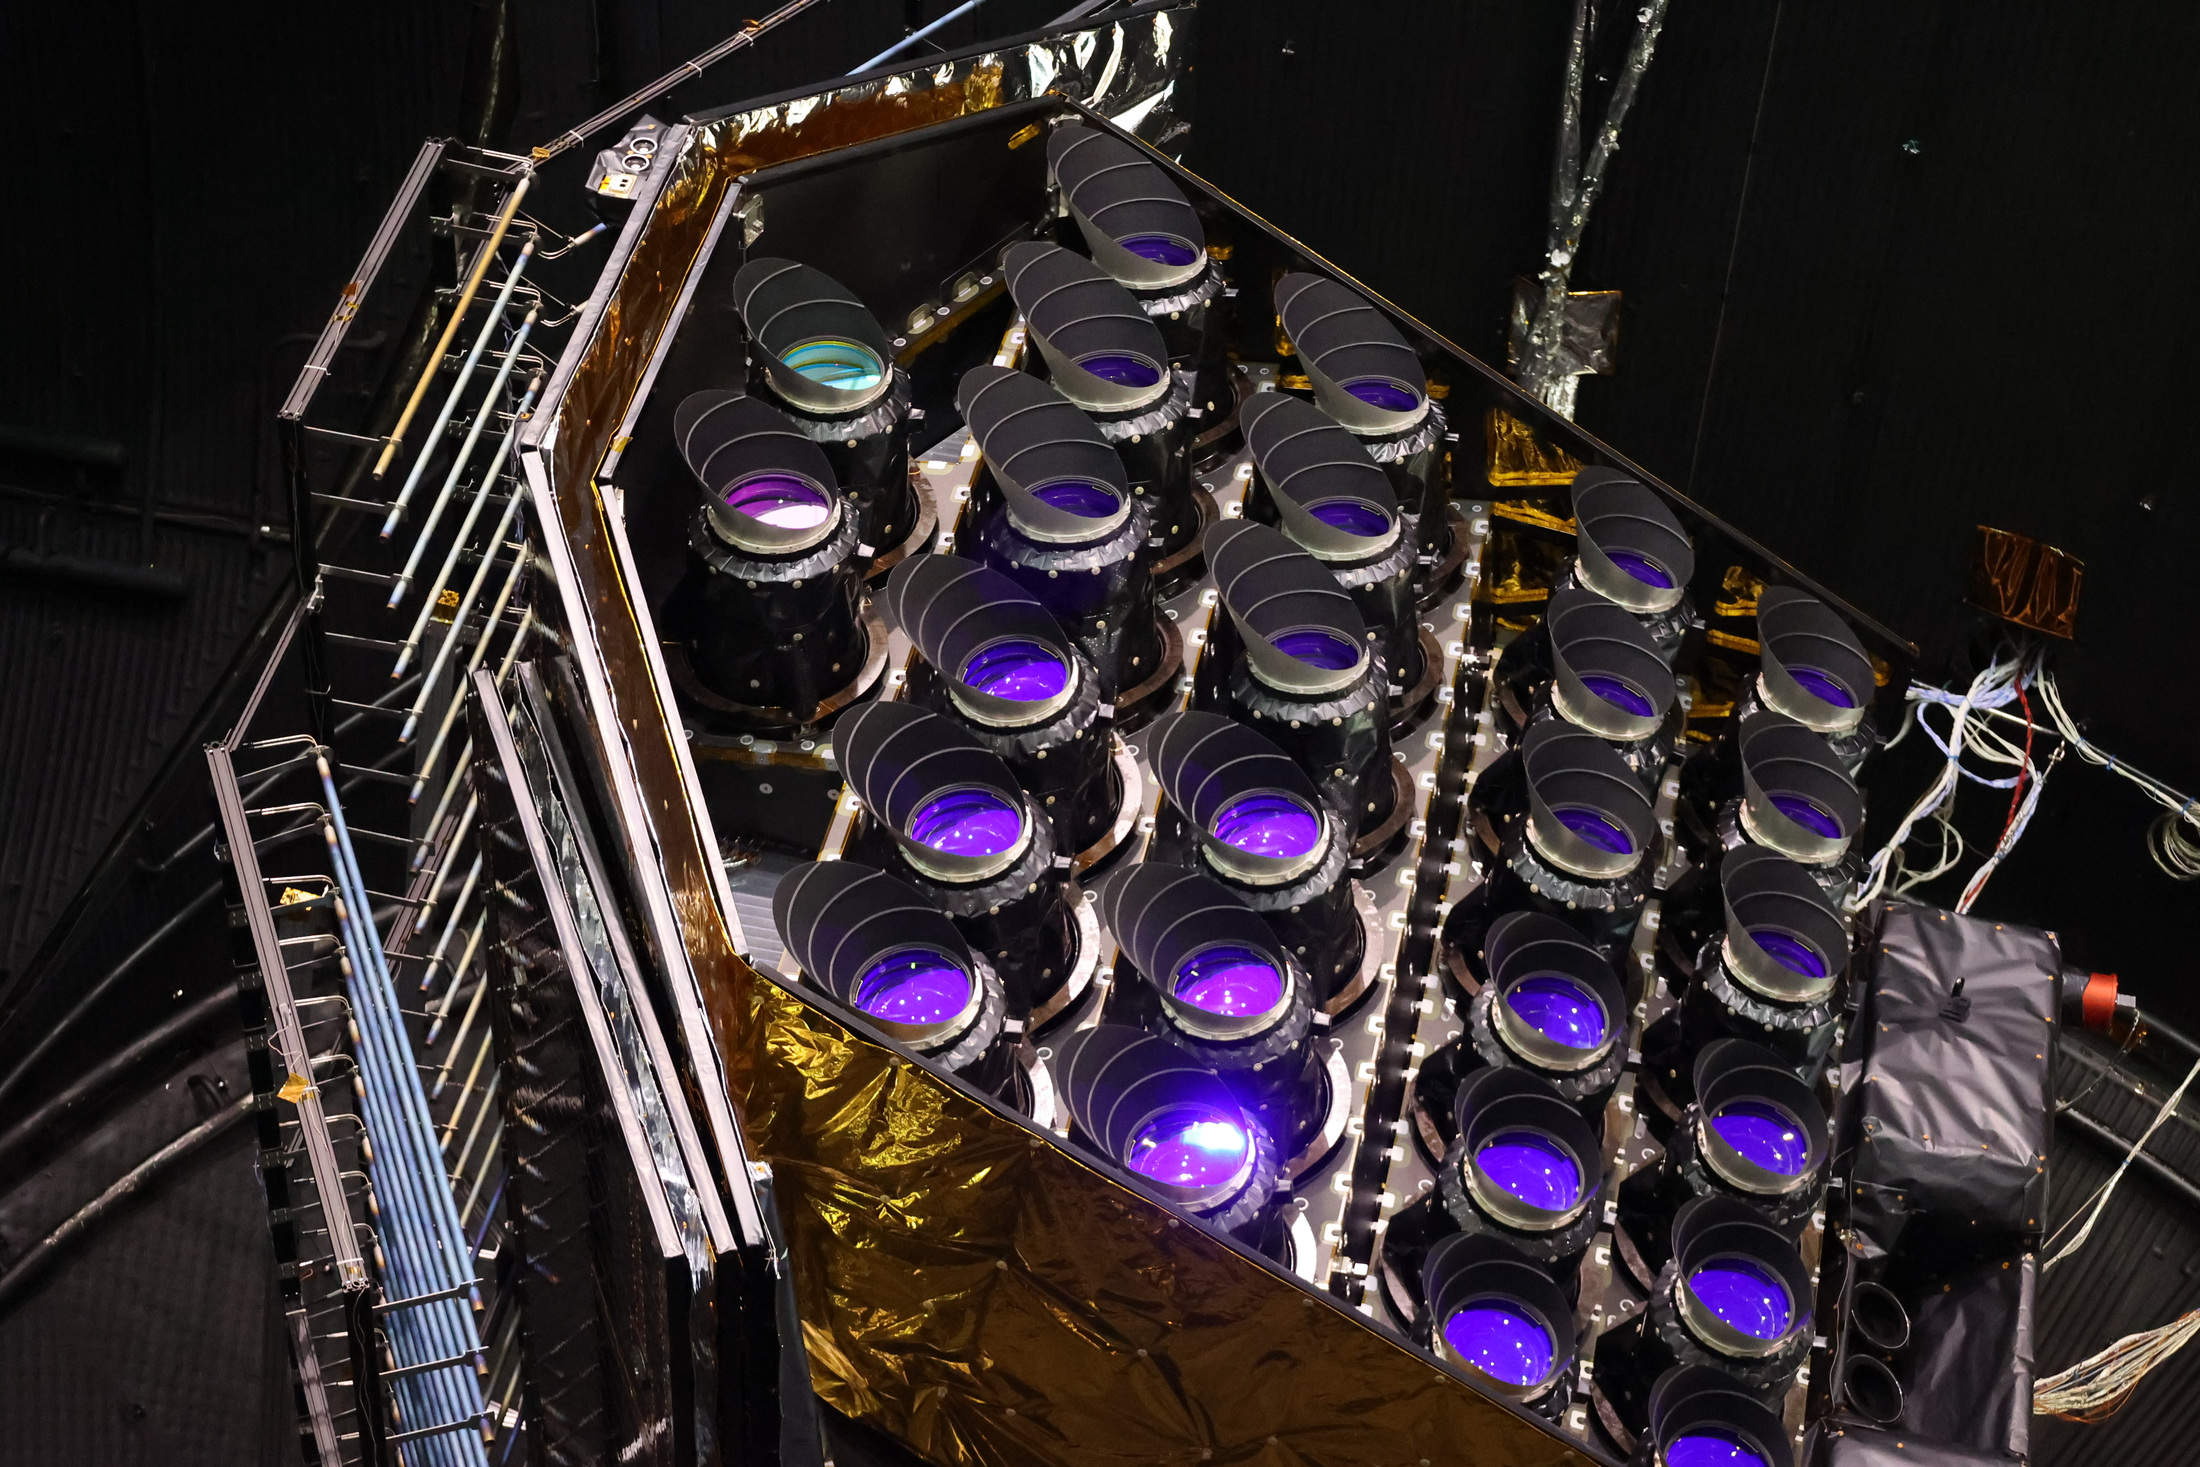
ESA’s upcoming PLATO mission, planned for 2027, will search for planets by watching their stars. Its 26 cameras will measure tiny changes in starlight. A planet can reveal itself by briefly blocking part of a star’s visible disk, even when the telescope cannot separate the planet from the star as an image. How does a small dip become evidence for a world? [1]
A telescope records brightness repeatedly and puts those measurements in time order. The resulting light curve is a record of changing light received by the instrument. When a planet crosses the face of its star from our viewpoint, the total light falls during the crossing and then recovers. That event is a transit. The measurement is the missing starlight; the planet is inferred from its effect. [3]
The orbit has to line up with us
Imagine walking around a lamp while someone watches from across a room. You block the lamp only when your path crosses their line of sight. A planet’s orbit has the same geometric requirement: it must carry the planet across the star as seen by our telescope. An orbit viewed from a different direction can contain a planet without producing any transit for us. [3]
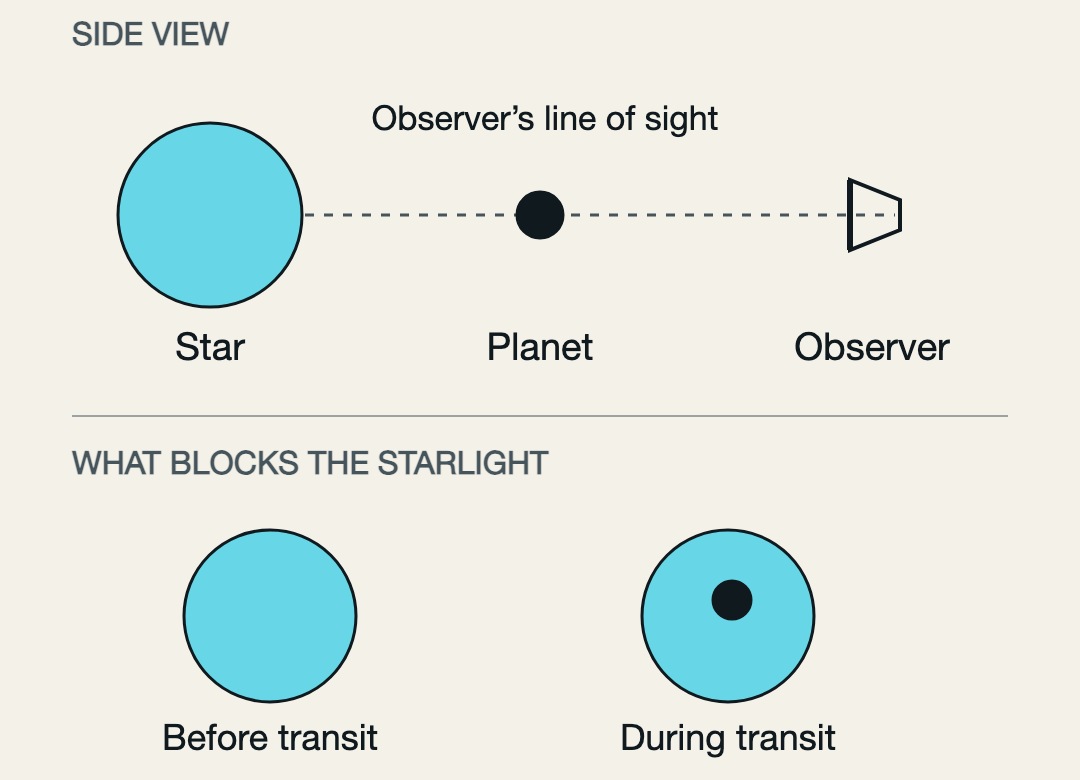
This creates a selection effect. A transit survey does not see every planet around every monitored star. It finds systems whose geometry, planet size, orbital period and observed signal make transits detectable. A star with no detected dips is therefore not automatically a star with no planets. [3]
A deeper dip usually means a larger silhouette
For a simple calculation, treat the star as a uniformly bright circle and the planet as a dark circle fully inside it. The blocked fraction is the ratio of their apparent areas. Since a circle’s area depends on the square of its radius, transit depth is approximately (planet radius ÷ star radius)². This is a useful first estimate; actual light-curve models include the star’s uneven brightness and the transit path. [3]
Take an illustrative planet with one hundredth of its star’s radius. Squaring 0.01 gives 0.0001: the light drops by about 0.01%, or 100 parts per million. Doubling the planet’s radius blocks four times as much area in this model. It does not merely double the dip. These numbers are a worked example, not measurements from PLATO. [3]
An illustrative transit
- Planet/star radius ratio0.01
- Blocked area fraction0.01 × 0.01 = 0.0001
- Brightness drop0.01%, or 100 parts per million
The depth gives a size ratio. To turn it into a planet radius in kilometres, astronomers also need the star’s radius. If the star is larger than assumed, the inferred planet is larger too. Characterising the host star is part of measuring the planet, which is why PLATO will also study variations caused by stellar oscillations. [1]
The next dip makes the prediction testable
One dip supplies a possible event. A recurring sequence lets researchers test a period. If similar dips occur every ten days, a simple planetary interpretation predicts another crossing ten days later. The depth and duration should also be consistent with the same object and geometry. Astronomers can align repeated observations to examine the pattern more clearly. [4]
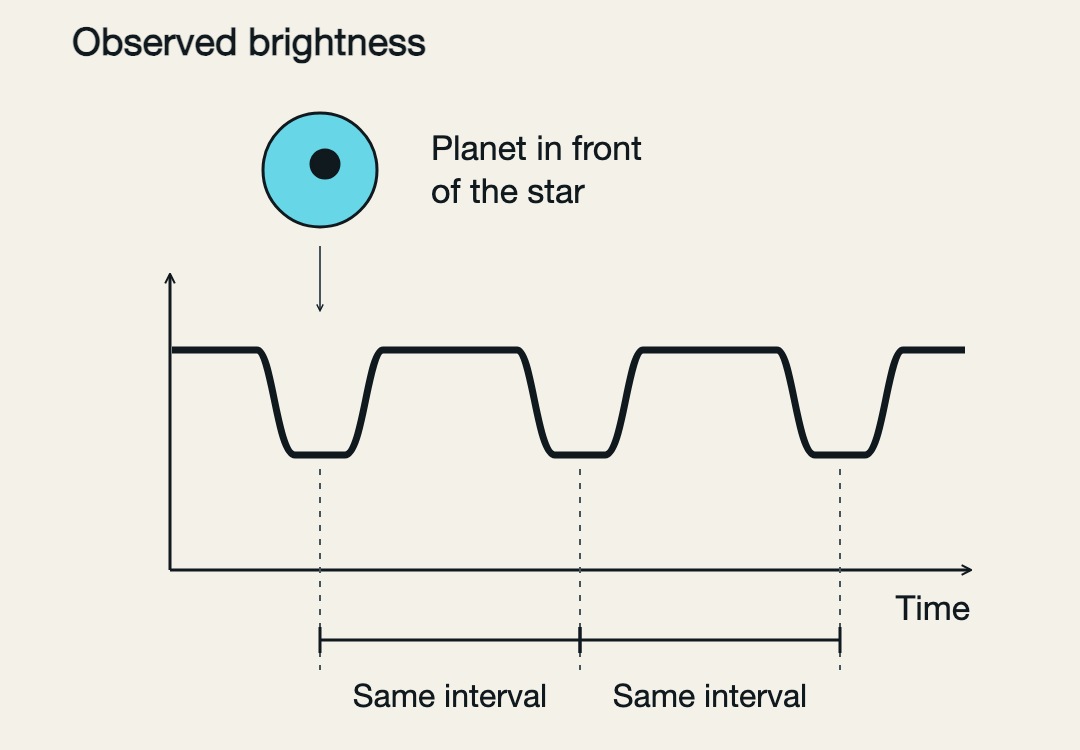
The interval is the orbital period, rather than the time spent crossing the star. A transit may last hours while the orbit takes days or months. With the host star’s mass, the orbital period can be used to estimate orbital distance. A longer-period planet also demands a longer observing baseline: the next useful crossing may be a long wait away. [4]
Keep measuring through the small change
PLATO’s camera array is designed for repeated observations of a large stellar field. Twenty-four normal cameras acquire images every 25 seconds; two fast cameras take images every 2.5 seconds. Their jobs and target ranges differ. Multiple cameras increase the observing capability, while the accumulated time series supplies the repeating evidence. [2]
The mission will send compact images around selected stars, rather than every pixel from every exposure. ESA describes these as small six-by-six-pixel imagettes. The aim is to retain the light needed for the stellar measurements while keeping the data that must be sent home manageable. The useful discovery product is the analysed sequence, not a resolved portrait of each planet. [2]
A repeating dip still needs other explanations checked
A transit-like signal first makes a candidate. An eclipsing pair of stars, including a fainter pair blended into the same view, can imitate a planetary dip. Instrument effects and changes in the star also need examination. Researchers inspect the signal, its location and follow-up observations to ask whether a planet is the best supported explanation. [5]
Radial-velocity observations provide a complementary test by measuring shifts in a star’s spectrum as its motion toward or away from us changes. The gravitational pull of an orbiting companion can produce that motion. Combined with transit geometry and stellar information, suitable measurements constrain the companion’s mass as well as its size. A candidate can have an estimated radius while its mass remains unmeasured. [5] [4]
Finding a planet is the start of describing it
A radius and an orbital period do not establish an atmosphere, a liquid ocean or life. Even a planet receiving an amount of starlight consistent with a habitable-zone orbit can have conditions that prevent surface liquid water. Atmosphere, surface and stellar activity affect the answer. The word habitable names a question to investigate, not a result obtained from a brightness dip. [6]
A favourable alignment produces a small loss of light; repeated losses reveal a predictable orbit; stellar measurements give that signal a physical scale; checks and follow-up separate a plausible planet from alternatives. Learning what the planet’s atmosphere contains is a further measurement, with its own evidence. [1] [3]
Sources & image credits
Related reading and objects
What are Lagrange points, and why is Webb at L2?
The view starts with choosing where to look from.