


From the spacecraft
Compare Hera’s actual imagesFind the smaller asteroid
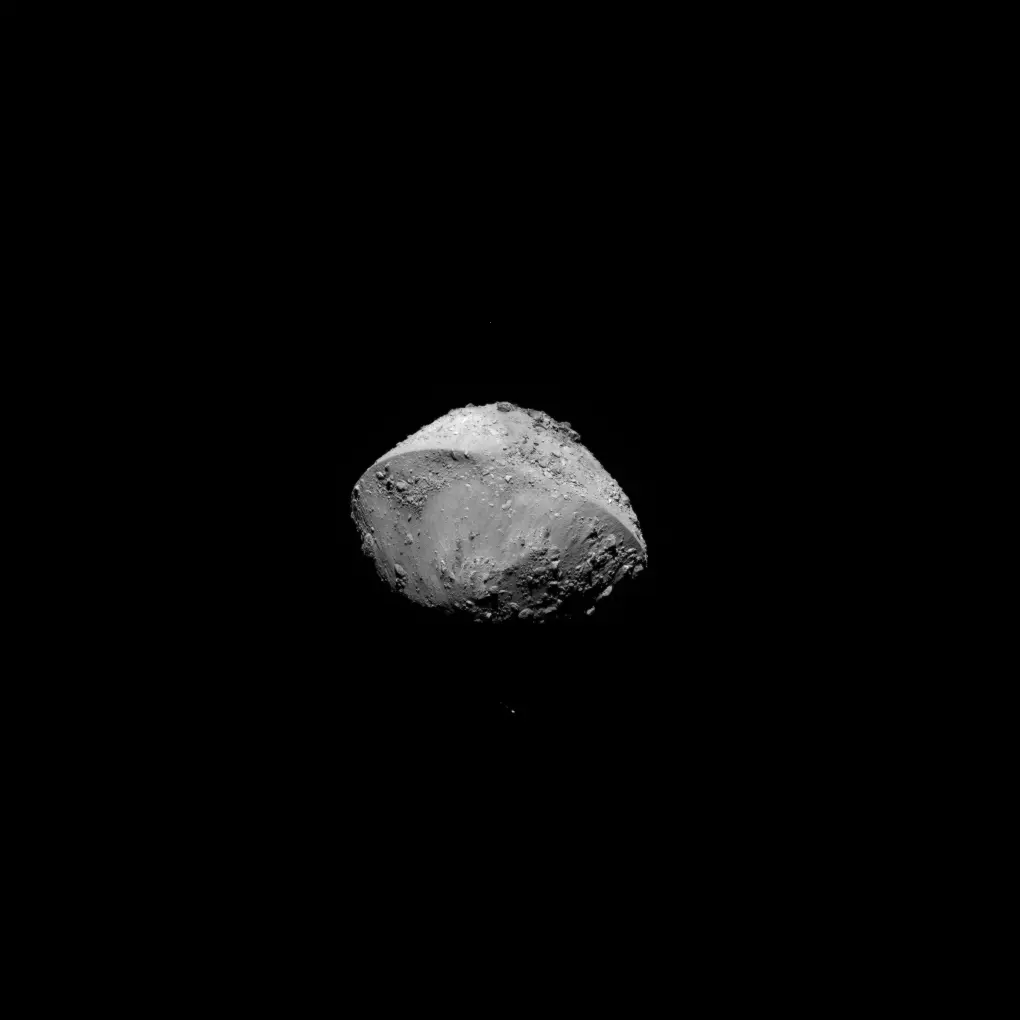
Start with the big rock with the ridge around its middle. That’s Didymos, about 780 metres across. Dimorphos is the roughly 150-metre moon that circles it. In the comparison ESA released on November 17, most of the side of Dimorphos facing the spacecraft was in shadow. The bright speck in the visible-light frame is the part still catching sunlight, not the size of the moon.
Hera took the two images a little over two minutes apart on November 6. The visible-light image puts Didymos 28.5 kilometres from the spacecraft, with a scale of about 2.7 metres per pixel. That scale is for the framing camera, not the thermal one. The frames also differ in framing: use them to find the moonlet, not to match individual surface features. The comparison above illustrates the effect; it doesn’t reproduce the spacecraft data.
Two kinds of infrared
Hera’s Asteroid Framing Camera sees reflected sunlight. HyperScout H stretches that approach into the near-infrared: it splits reflected light into 25 bands, from visible red into wavelengths your eyes can’t see. How much light the surface reflects in each band can give scientists clues about the minerals there.
JAXA’s Thermal Infrared Imager, or TIRI, works farther into the infrared. Its wide-band filter records wavelengths of 8–14 micrometres. It detects radiation given off by the surface itself. A shadow can stop direct sunlight in an instant, but the rock doesn’t lose all its heat in an instant. It keeps emitting infrared as it cools, which is why TIRI could pick out the moonlet where the visible-light camera mostly saw dark sky. In ESA’s published thermal view, red marks warmer areas and blue cooler ones. Those colours are assigned for display; the asteroid isn’t glowing red.

What the cooling rate tells us
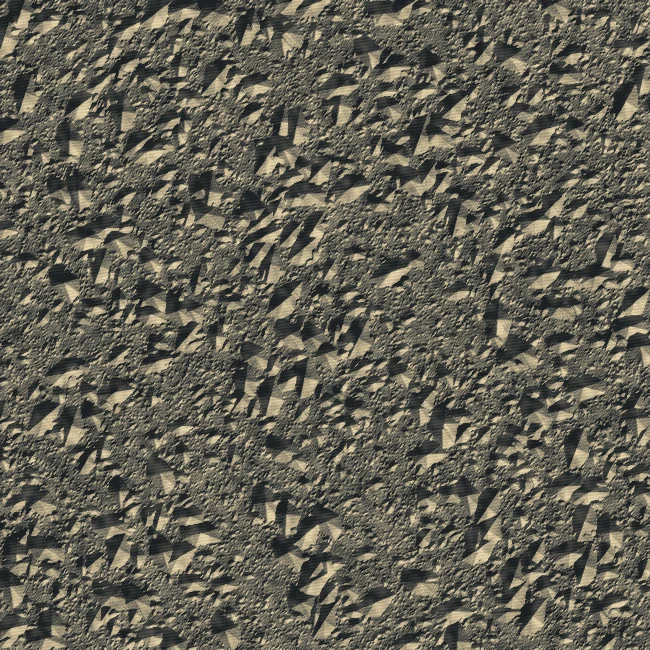
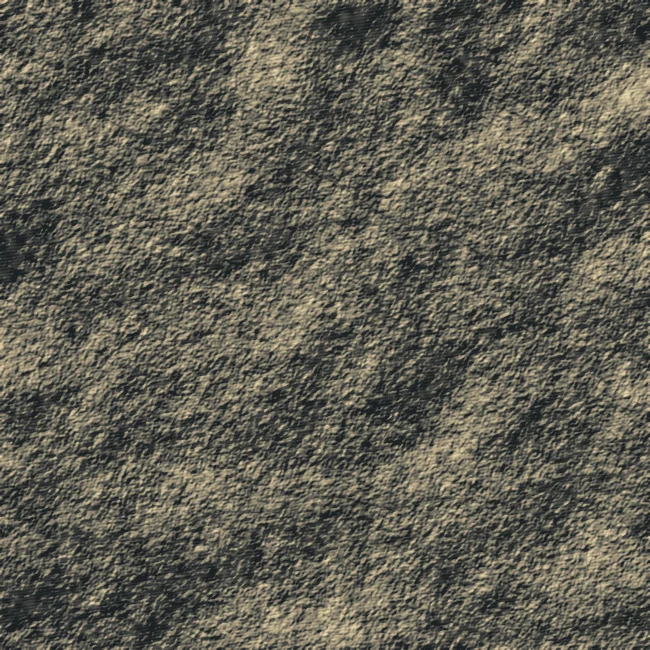
JAXA converts detector readings to temperatures using a calibration worked out before launch. The next step is to follow the same ground through different lighting. Under similar conditions, a loose layer of fine grains tends to warm up and cool down faster than a large, solid rock. Scientists call the resistance to that temperature change thermal inertia. It can help them tell whether a patch behaves more like loose grains or exposed rock.
A single cool patch doesn’t settle that question. It might be shaded, tilted away from the Sun or simply seen at a different point in the local day. In a separate set of earlier JAXA images, part of Dimorphos lay in the shadow cast by Didymos. That is a good reason to compare the temperatures with surface maps and the position of the Sun before drawing conclusions about the material. TIRI measures the surface: it doesn’t see through it.
 01 · Loose grains
 02 · Solid rock
What DART changed, and what it left unanswered
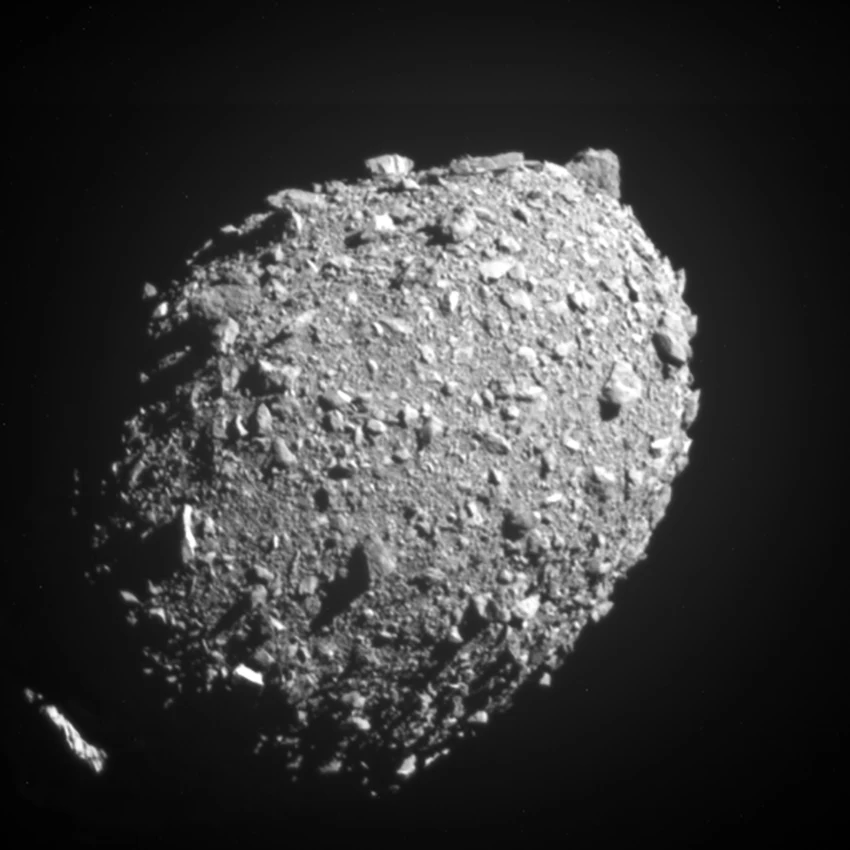
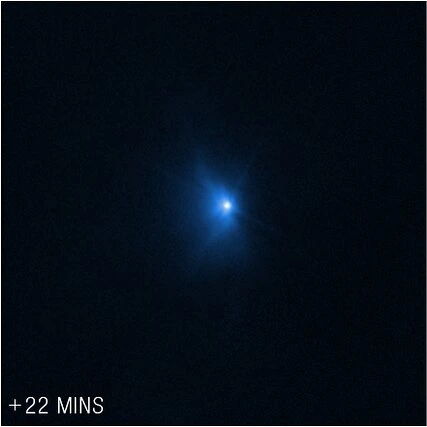
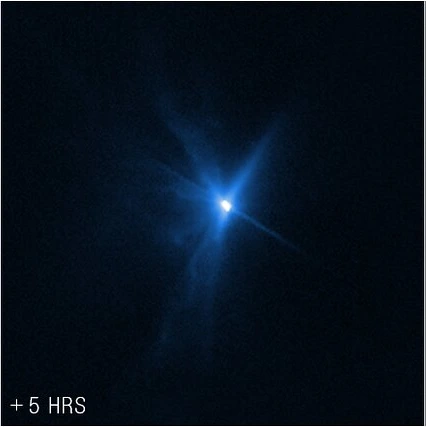
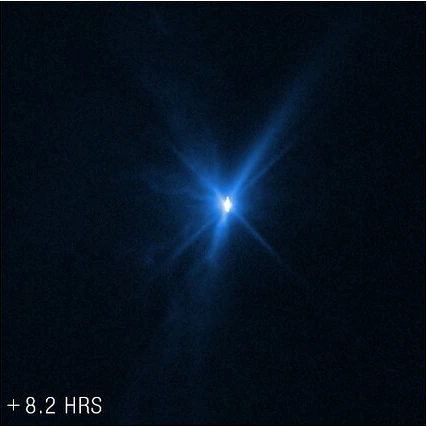
On September 26, 2022, NASA’s roughly 580-kilogram DART spacecraft hit Dimorphos at about 6.1 kilometres per second. Astronomers didn’t need to see a crater to establish that the hit worked. From Earth, they timed recurring dips in the combined light as the two asteroids passed in front of one another or through each other’s shadows. The dips started coming sooner. A later JPL analysis put the settled orbit at about 11 hours 22 minutes, 33 minutes 15 seconds shorter than before. That is the time for Dimorphos to circle Didymos, not the pair’s much longer orbit around the Sun.
The same study inferred that Dimorphos had become more elongated, but that shape was fitted to the observations, not mapped up close. DART photographed the boulders on approach. Italy’s LICIACube photographed the expanding plume. Hera can now look for what stayed behind: a crater, changes to the surface well away from the impact, or both. The first thermal outline is too coarse to settle that.
Why Hera needs to weigh the moonlet
It takes more momentum to give a heavy object the same change in speed as a light one. So the change to Dimorphos’s orbit doesn’t tell us how much momentum DART transferred unless we also know the moonlet’s mass. And some of that push came from rock thrown out by the impact, like exhaust pushing in the opposite direction. How much the ejecta added remains sensitive to the assumed mass, as the DART team’s momentum study shows.
Hera’s first way to weigh Dimorphos is to watch Didymos. The larger asteroid wobbles slightly around the pair’s shared centre of mass. Tracking fixed boulders over time helps Hera’s team measure that wobble. The team will also look for tiny changes in the frequency of Hera’s radio signal as gravity changes the spacecraft’s motion. The two measurements constrain the mass in different ways.
How Hera will get a closer look
Hera started its survey on a roughly rectangular route, passing about 25–30 kilometres from the pair. The asteroids’ gravity is weak enough that the spacecraft uses small manoeuvres to turn between the legs. ESA’s mission plan calls for a closer, bow-tie-shaped survey starting in December, with metre-scale mapping as Hera draws nearer. Later flybys will target the DART impact region. Those images are the way to test whether the shape inferred from Earth matches the terrain in front of Hera.
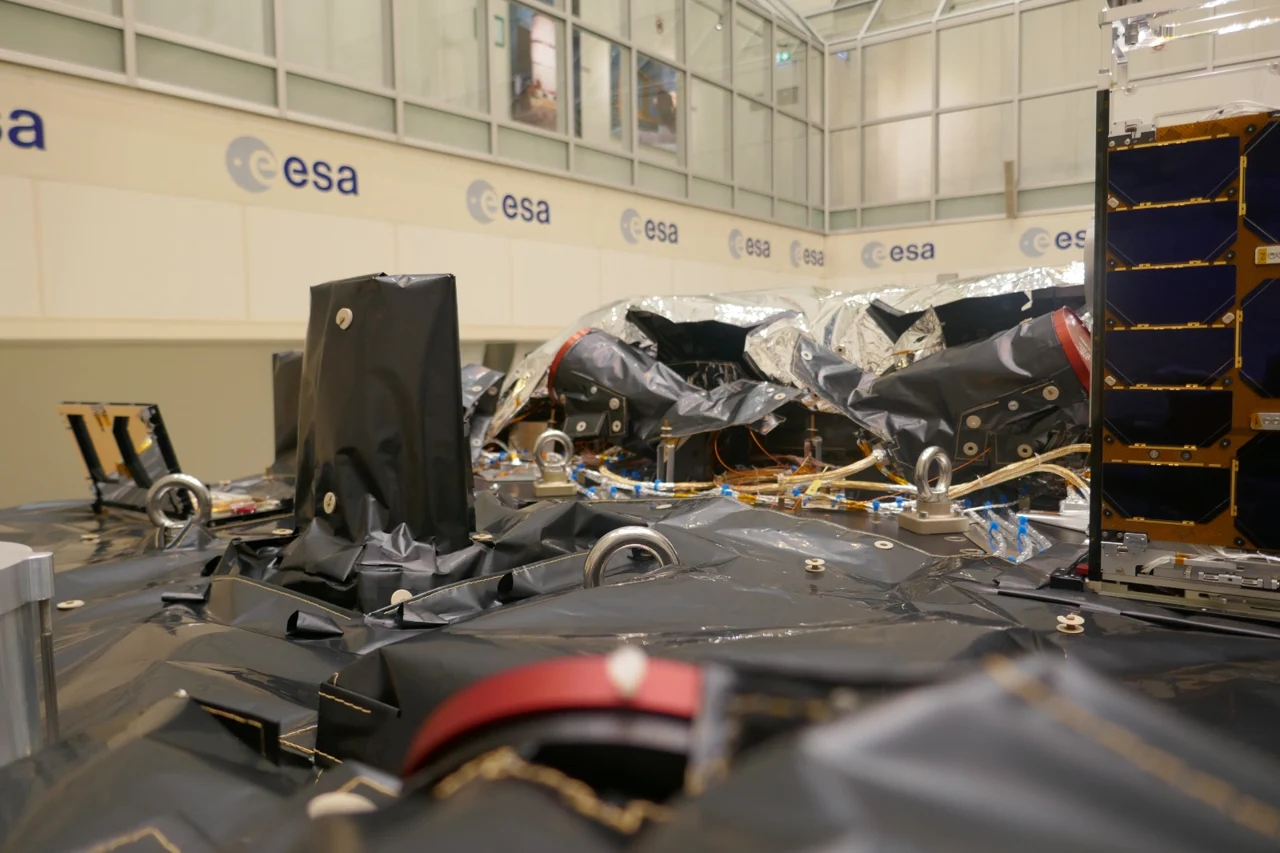
Two small spacecraft are due to join Hera in early 2027. Juventas will use radar to probe the interior of Dimorphos. If it can operate after touchdown, its gravimeter will measure the weak pull at the landing site. Milani will use a multispectral camera to compare the surface composition of the two asteroids and an instrument to study dust. Hera supplies the wider view. Together, the measurements can connect what came off in the impact with what the moonlet is made of and how it responded.
When ESA will show the first close-ups
ESA plans to unveil Hera’s first detailed post-impact images of Dimorphos on Wednesday, November 25, 2026, at 18:45 UTC (19:45 CET). The broadcast is scheduled for 45 minutes. Watch on ESA’s official channels.