

What do Andromeda’s stars reveal about its history?
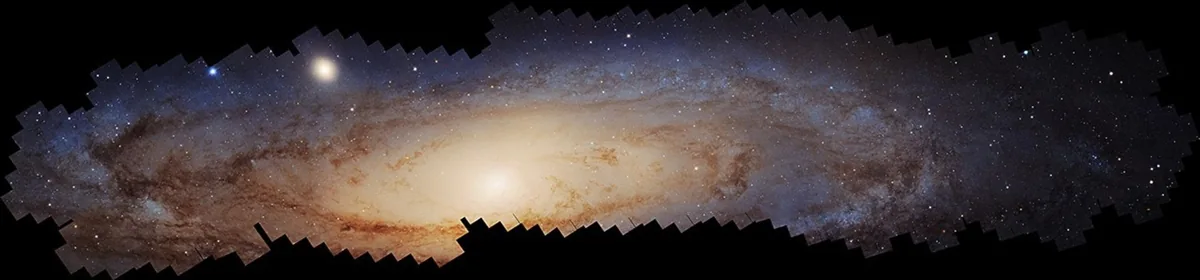
A Hubble panorama released in January 2025 resolves roughly 200 million stars across Andromeda. By comparing their colours, brightnesses and locations, astronomers can investigate how our nearest large galactic neighbour assembled its disk.
An external view supplies the missing perspective
Andromeda, also called M31, lies about 2.5 million light-years away. It is a large spiral galaxy within the Local Group, the same galactic neighbourhood that contains the Milky Way and Triangulum. [1] [2]
Our location inside the Milky Way makes a global view of our own disk difficult. Andromeda supplies an external comparison: astronomers can examine a large part of another spiral’s structure while still resolving many individual stars. [1] [2]
The galaxy is highly inclined to our line of sight. Dust lanes cross its projected disk, and stars at different depths overlap. Even this useful outside view therefore needs careful interpretation rather than being treated as a flat diagram. [1] [2]
Many small fields build one large measurement
Hubble sees a narrow field compared with Andromeda’s large apparent extent. The 2025 panorama combined more than a decade of observations through the PHAT and PHAST programmes, assembling hundreds of overlapping fields into a mosaic of at least 2.5 billion pixels. [2]
The estimated 200 million resolved stars are only part of Andromeda’s total population. Fainter stars lie below the survey’s sensitivity, and crowding or dust can limit detections in particular regions. A resolved-star count should not be presented as the galaxy’s entire stellar census. [2]
The overlapping observations allow researchers to compare locations across the disk under a documented survey strategy. That consistency makes patterns in stellar populations more useful than a collection of unrelated beautiful fields. [2]
Colour and brightness encode a history
A star’s colour and luminosity depend on its mass, composition and evolutionary state. Studying many stars together lets astronomers estimate the ages and histories of populations, with models and uncertainties attached. [2] [1]
Young, hot stars cluster in some regions, while older populations contribute strongly to the central glow and other parts of the disk. Dust changes the observed colours by absorbing and reddening starlight, so its effect has to be separated from the properties of the stars themselves. [2] [1]
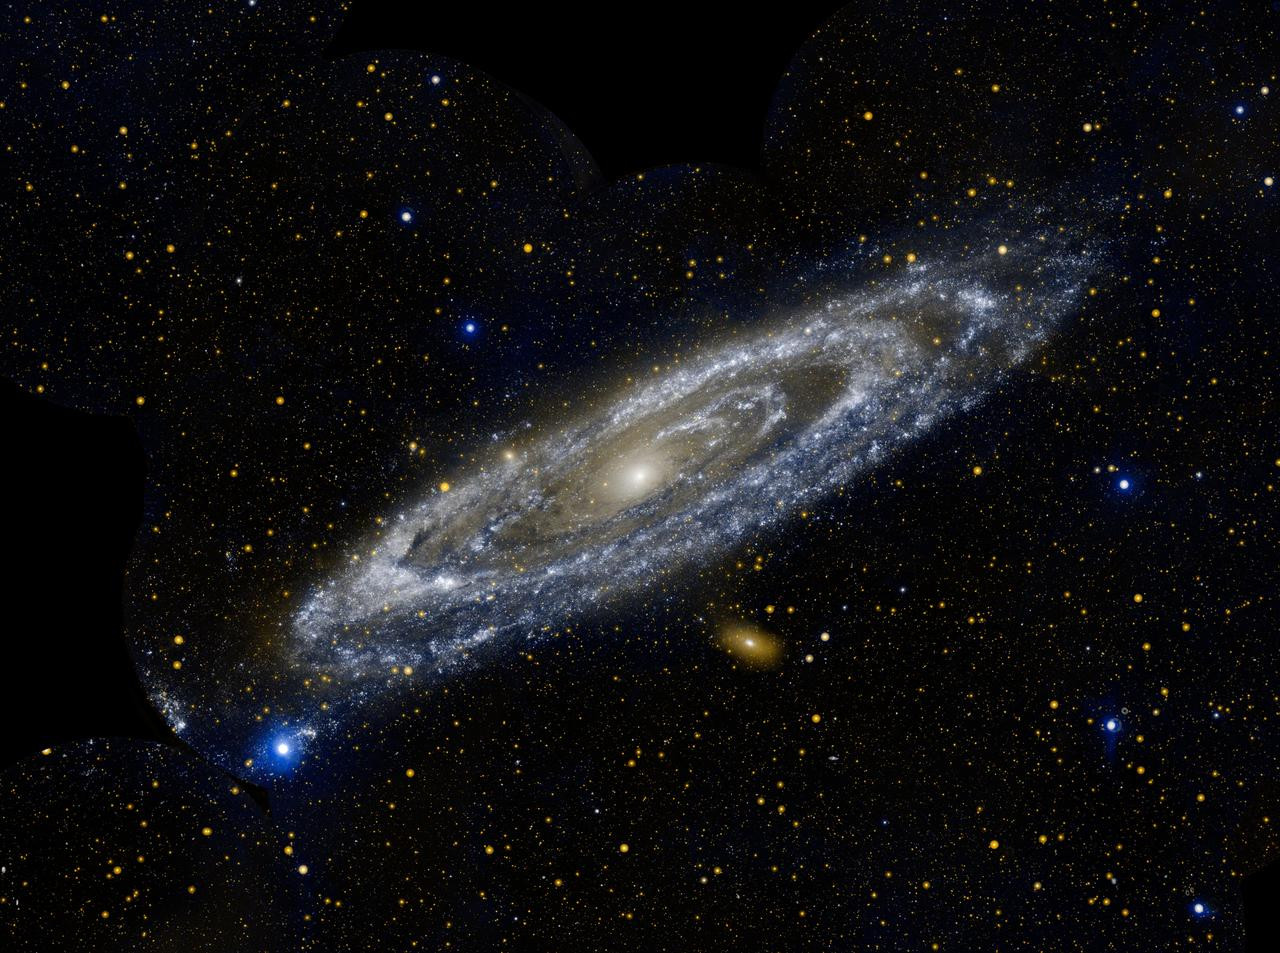
The map becomes a record of when and where stars formed. It is not a direct photograph of the galaxy’s past; it is a reconstruction from objects whose present properties preserve information about earlier conditions. [2] [1]
Different halves preserve different disturbances
The southern survey extended the earlier northern-disk map and revealed regions particularly sensitive to Andromeda’s merger history. Differences in stellar populations and structure point towards a more disturbed evolution than a simple picture of a quiet, steadily growing disk. [2]
Interactions can add stars, redistribute existing material and change where gas forms new stars. A nearby companion such as M32 may preserve evidence relevant to that history, but identifying a specific past collision requires more than noticing two galaxies close together in a projected image. [2]
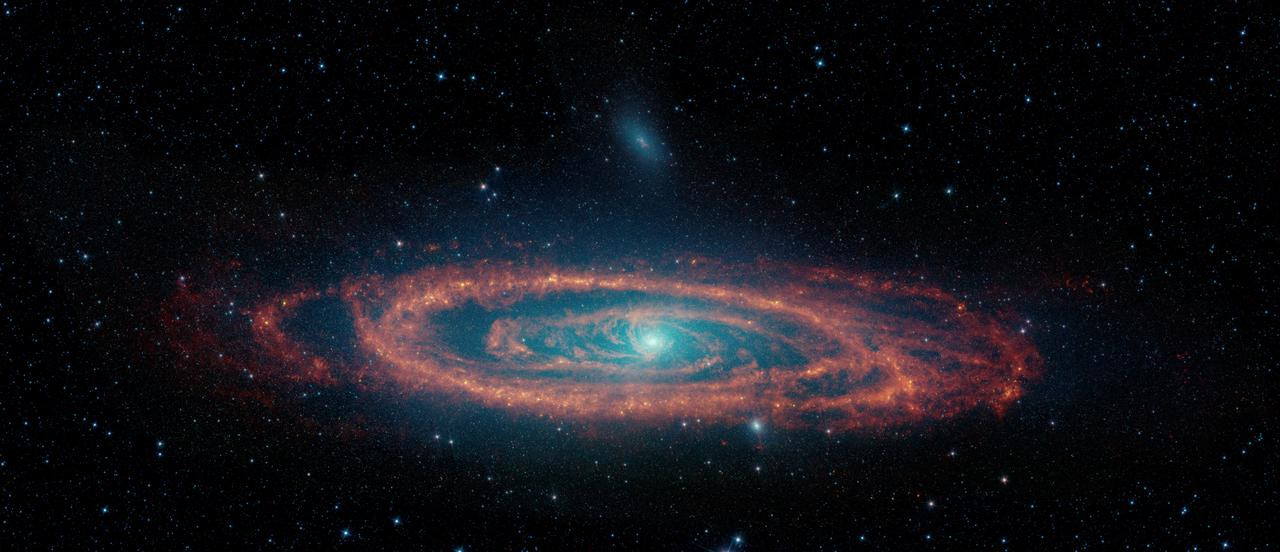
A credible reconstruction must reproduce the observed populations and geometry together. The mosaic supplies constraints against which competing histories can be tested. [2]
A neighbour is a test case, not a duplicate
Andromeda and the Milky Way share a broad spiral structure, but that does not make their histories identical. Differences in star formation and accretion show how galaxies of comparable scale can arrive at different present states. [2] [3]
The Hubble map is valuable because it combines a global context with individual stars. A bright band becomes a set of populations with ages, locations and relationships, allowing researchers to investigate the processes that built it. The photograph shows where the evidence is; stellar analysis turns that evidence into a history. [2] [3]
Sources & image credits
Related reading and objects
How do we map the Milky Way from inside it?
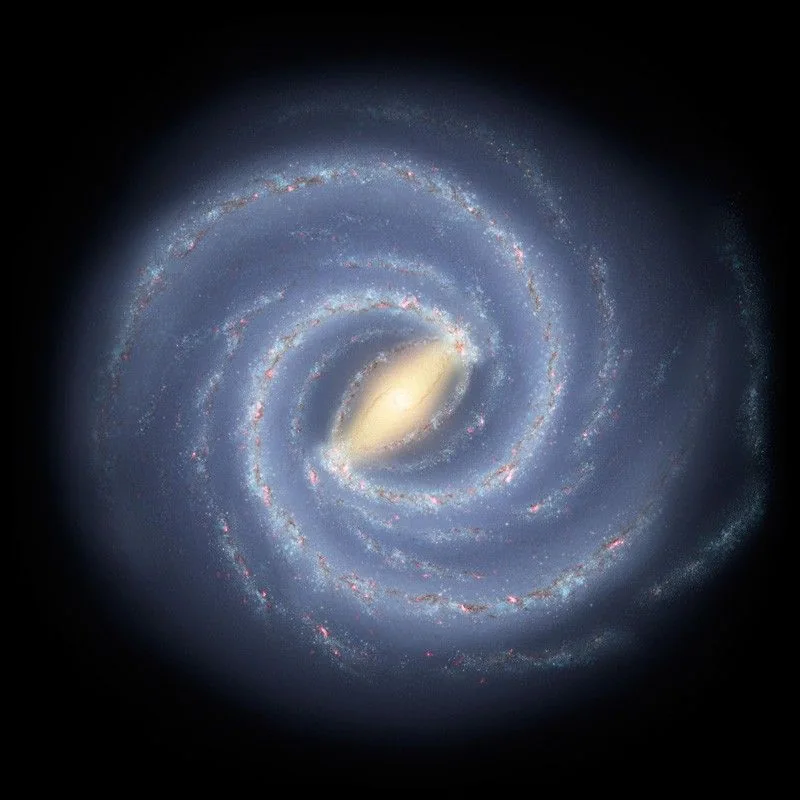
ESA’s Gaia mission repeatedly measured stars across the sky from 2014 to 2025. Those observations address a problem no external photograph can solve for us: the Solar System sits inside the Milky Way’s dusty disk, so its structure must be reconstructed from within.
Why is Triangulum full of bright stellar nurseries?
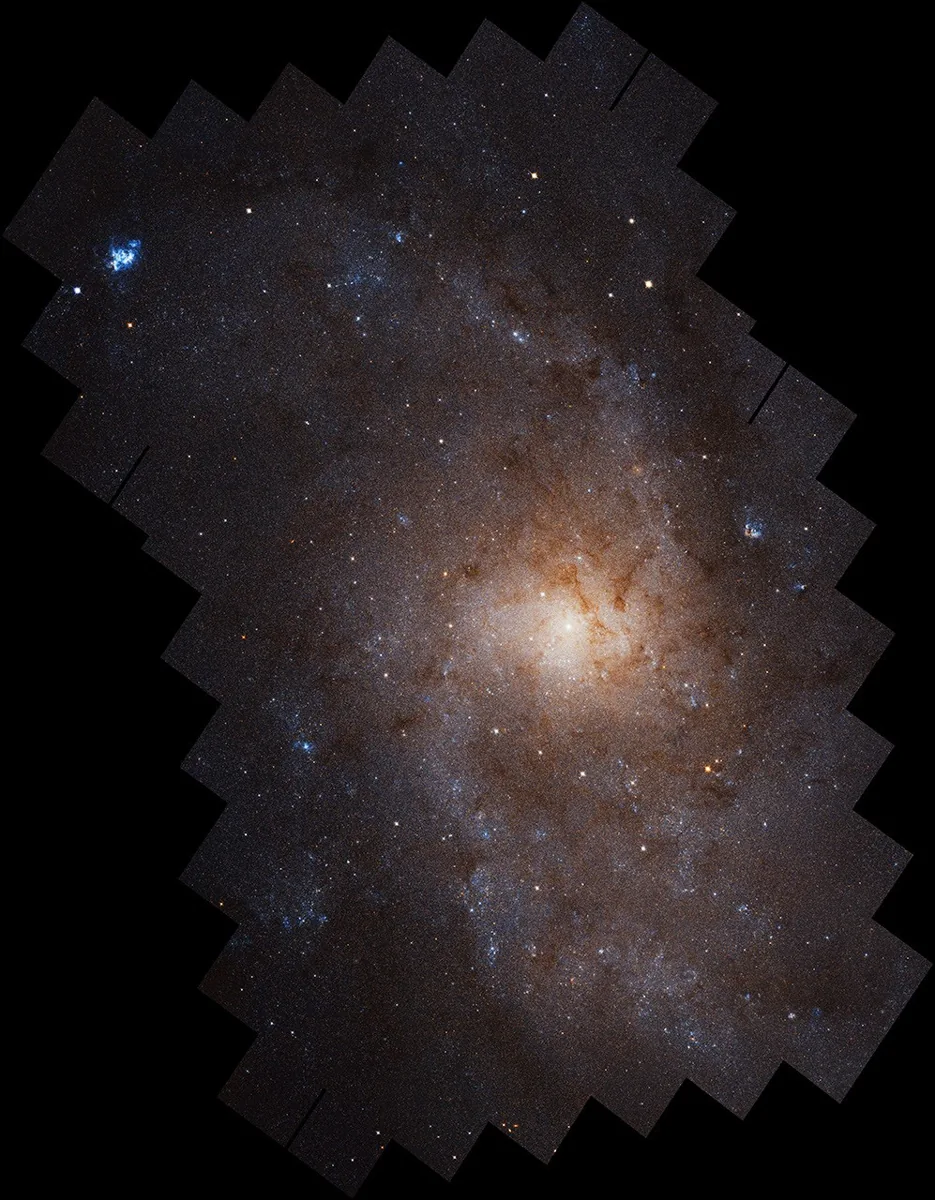
Hubble’s mosaic of Triangulum resolves nearly 25 million stars. Within the same galaxy, Webb’s 2024 images of NGC 604 show massive young stars excavating cavities in their birth cloud. Together the observations connect a galaxy-wide pattern with the physics inside one nursery.