

How a Blue Marble is built
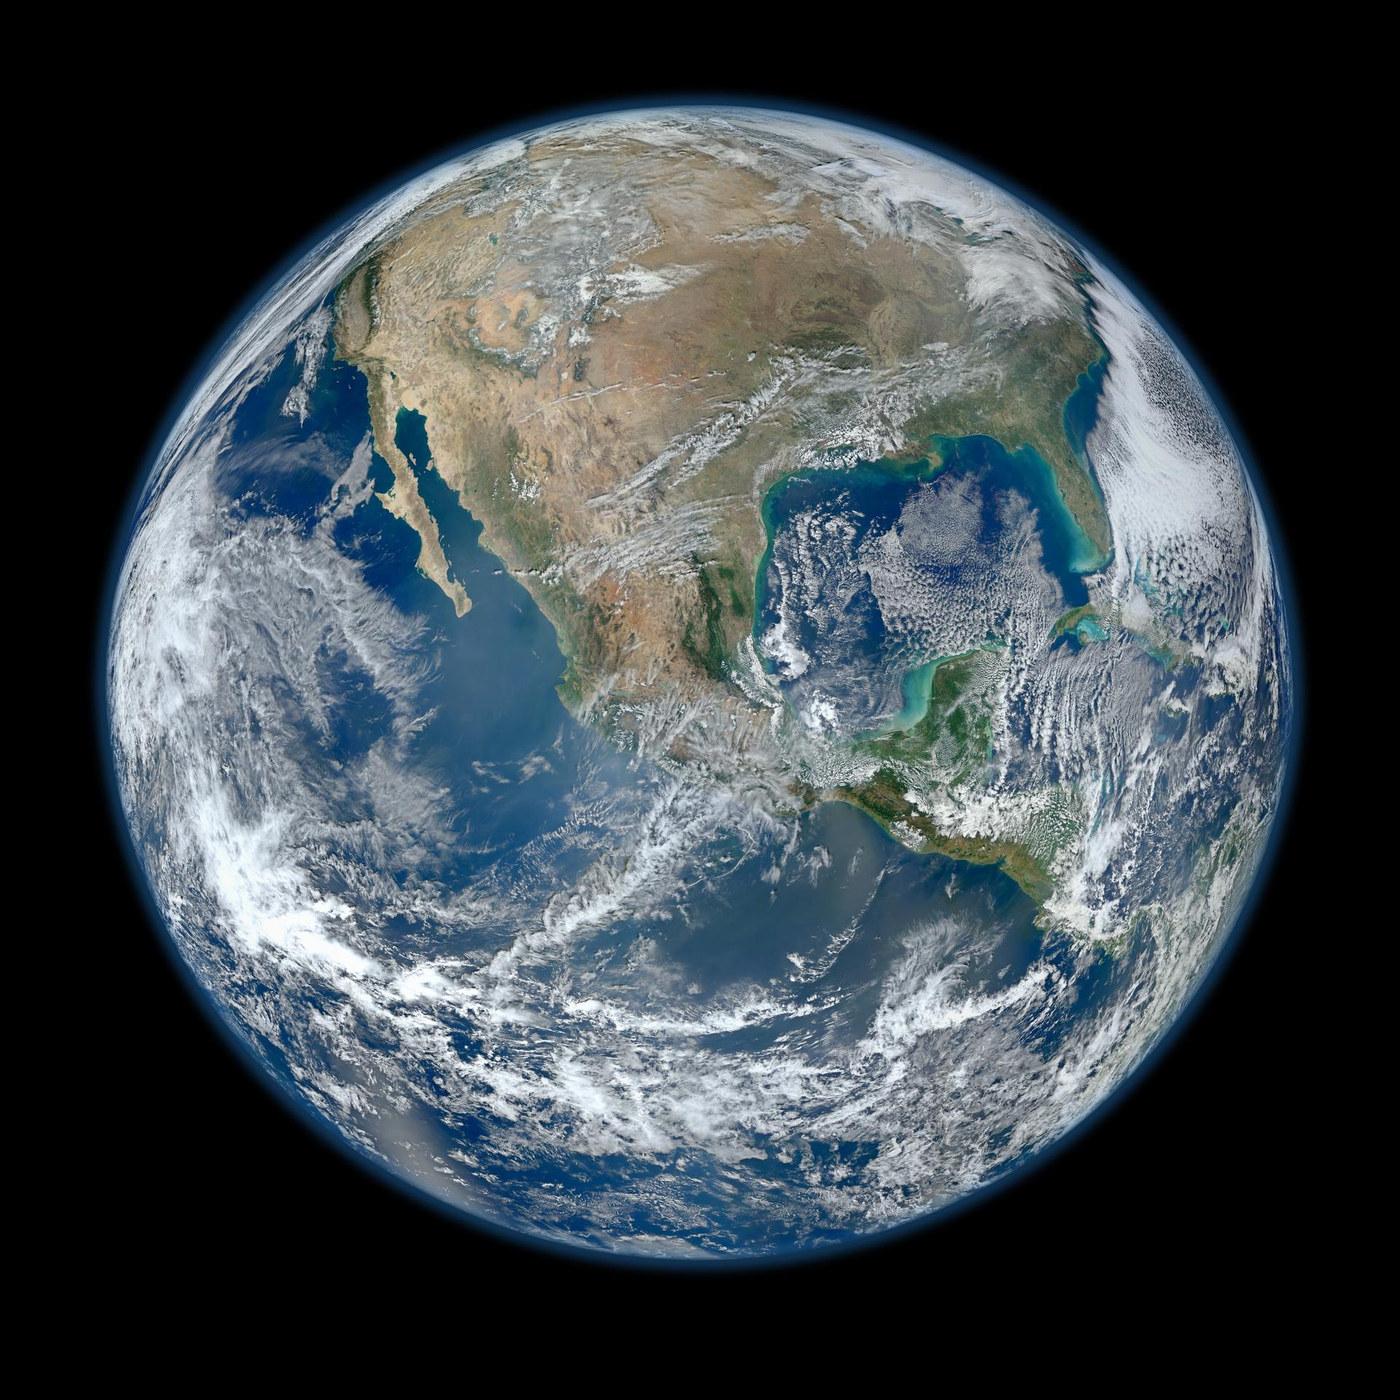
Suomi NPP’s VIIRS instrument supplied the observations used for the 2012 Blue Marble shown here. The globe is a composite assembled from orbital swaths. Understanding that construction makes it more useful as evidence—and explains why it is different from one distant snapshot.
A low-orbit satellite sees a strip at a time
Suomi NPP travels close enough to Earth that its instrument cannot capture the whole illuminated globe from one position. VIIRS scans a broad strip beneath the spacecraft while the orbit carries it onward. Earth turns below the orbit, allowing later passes to cover different longitudes. [1] [2]
The 2012 composite combines observations from several passes and projects them onto a globe. Its continuity is a processing result built from real measurements. The visible continents, clouds and ocean were not all recorded at one instant from a camera hovering over that apparent viewpoint. Acquisition time matters whenever the subject can change between passes. [1] [2]
The instrument measures reflected and emitted radiation
Different observing wavelengths respond to different physical properties. Visible channels record reflected sunlight. Thermal measurements reveal emitted radiation that depends on temperature and the atmosphere between the surface and the instrument. A false-colour product can expose patterns that a natural-colour rendering would make difficult to distinguish. [2] [3]
Colour should therefore be interpreted with the product’s legend and description. A bright cloud in one image may not look bright in another band. Clouds can obscure a surface observation while being the subject of an atmospheric measurement themselves. The same orbital pass can support several questions, provided the channels are not treated as interchangeable. [2] [3]
A globe is a choice of viewpoint
Mapping swaths onto a sphere removes the familiar rectangular map boundary, but it does not remove choices about perspective, orientation and scale. A continent nearer the edge is foreshortened. A composite may also be resampled to match the final display. Comparing distances by eye across the finished disk can consequently be misleading. [1]
For quantitative work, use the geolocated data and its projection information. For interpretation, begin with what the picture shows clearly: the arrangement of land, water and clouds and the extent of the observed hemisphere. Then ask which apparent details depend on the viewing geometry or on the processing that produced the image. [1]
One beautiful image cannot measure a trend
Detecting change requires comparable observations through time. Instruments must be calibrated, and seasonal cycles, clouds, illumination and orbital sampling must be considered. A difference between two attractive pictures can arise from those factors even when the underlying surface has changed little. [4] [2]
That is why long-running missions and overlapping records matter. Ocean altimetry, magnetic surveys and multispectral imaging each measure different parts of Earth’s system. The atlas connects those investigations to their actual launches. The Blue Marble provides a global view; the measurement methods explain which questions each satellite can answer. [4] [2]
Sources & image credits
Related reading and objects
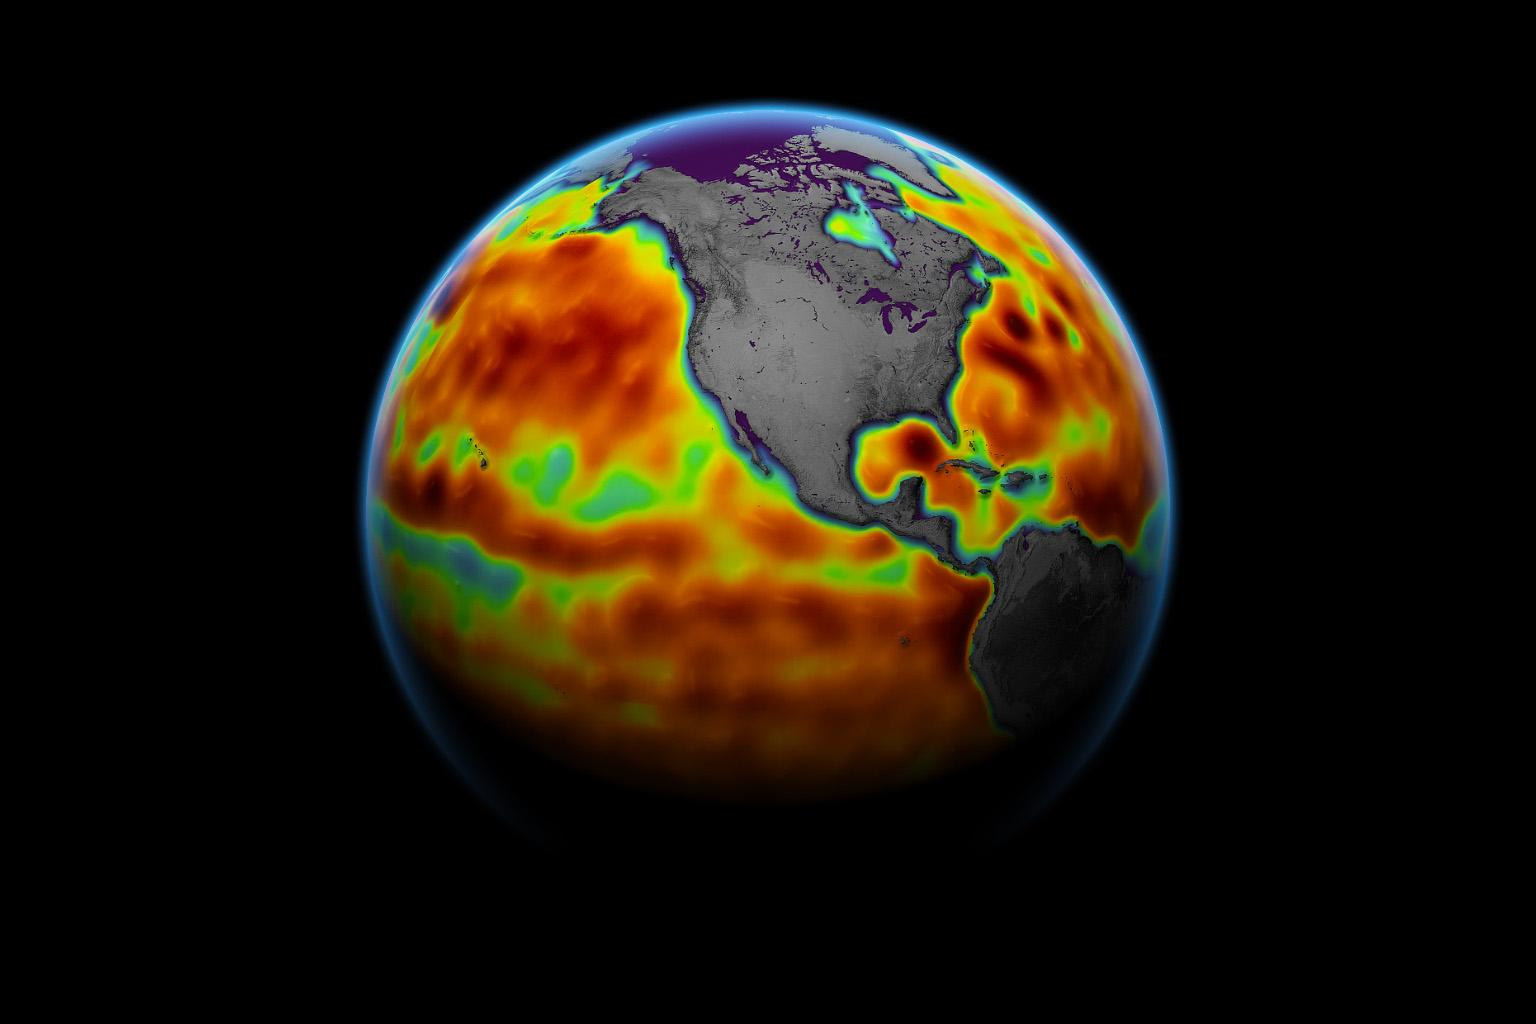
How a satellite measures the height of the ocean
Sentinel-6 Michael Freilich carries a radar altimeter that times echoes from the ocean. The mission’s launch record leads to a deceptively simple question: how can a spacecraft moving hundreds of kilometres above Earth measure changes in sea level?
Reading Earth’s magnetic field from orbit
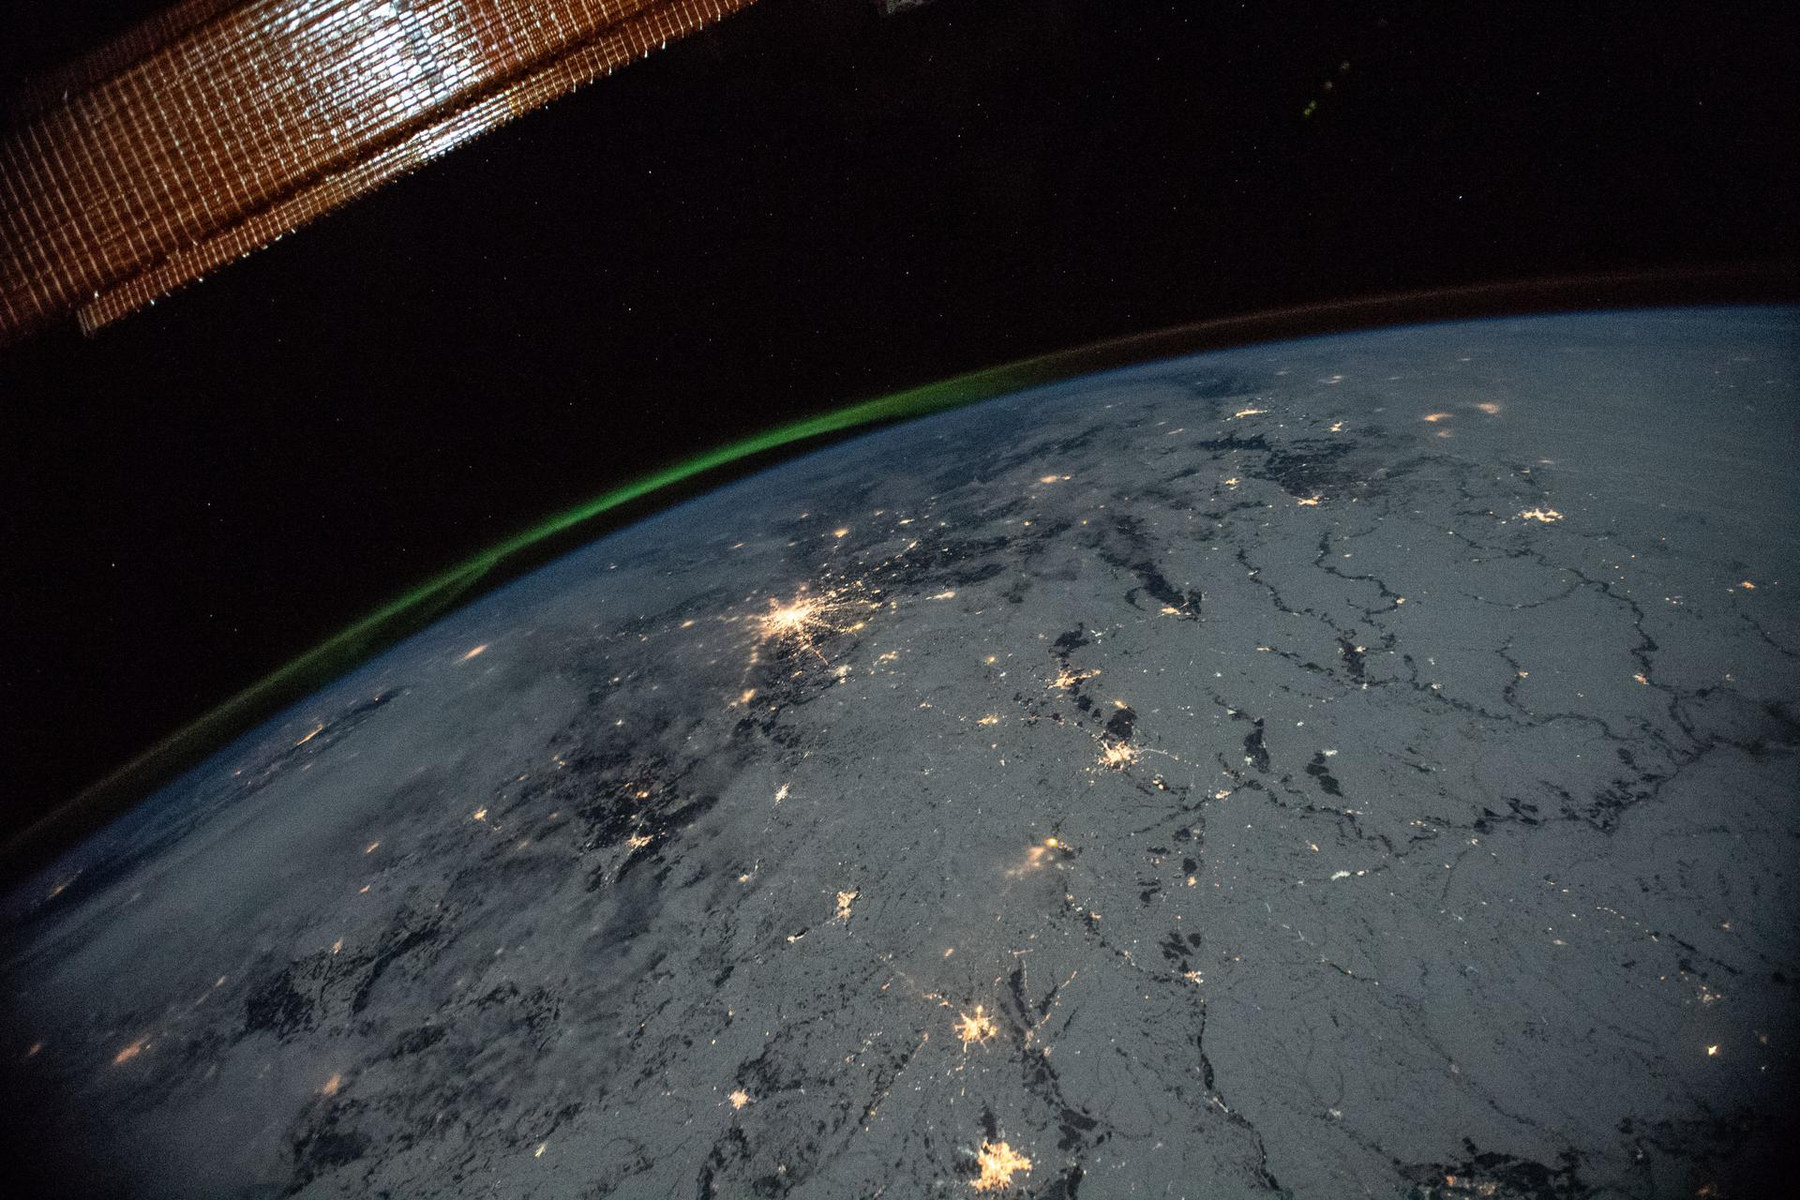
ESA launched three Swarm satellites to measure a field made mostly thousands of kilometres beneath our feet. Their instruments also detect magnetised rocks, currents in space and even moving seawater. To understand Earth’s magnetic field, they must separate those signals.