

How radar draws a hidden planet
Magellan travelled to Venus aboard the STS-30 mission, then mapped a surface hidden beneath global cloud. Its radar images are measurements of returning radio signals. Learning to read them begins by separating a strong echo from a high mountain.
Looking below the clouds
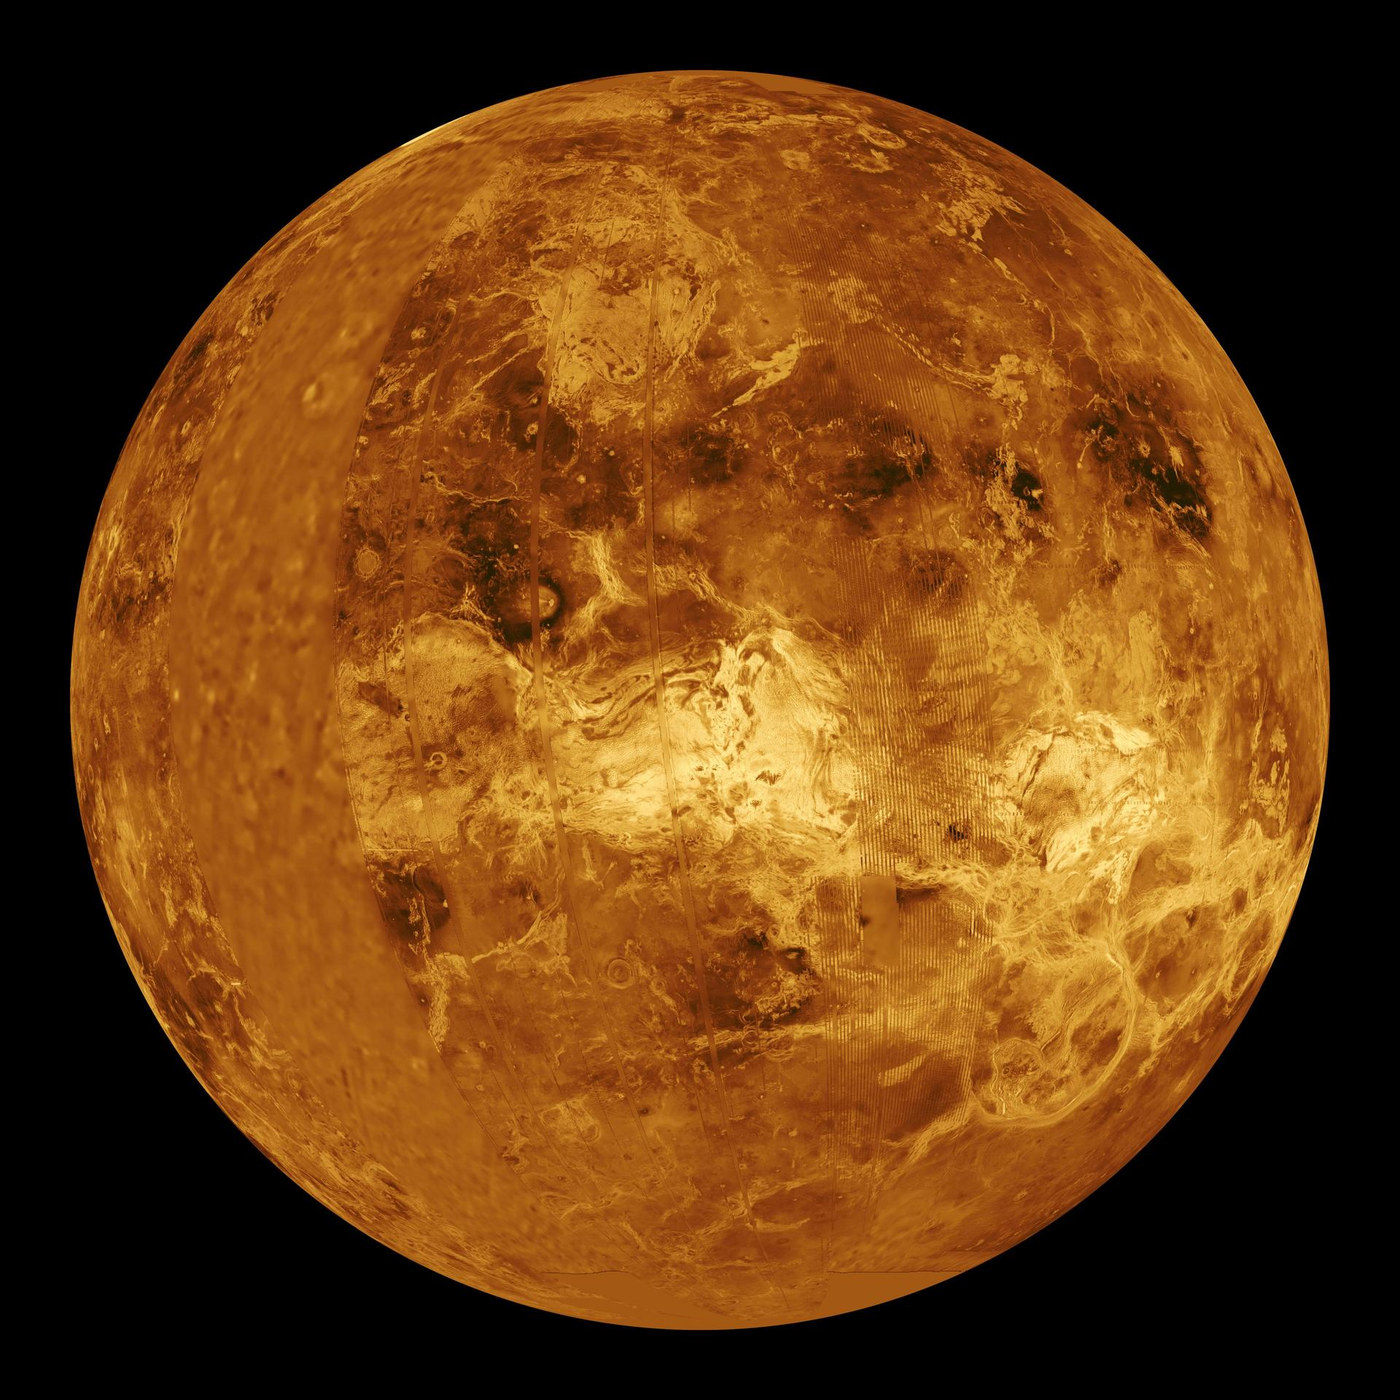
An ordinary visible-light camera sees Venus’s cloud deck. Radar uses radio wavelengths that can pass through that cover and interact with the ground. Magellan transmitted pulses sideways toward the surface and recorded their echoes as it moved along its orbit. Combining the signals produced detailed synthetic-aperture radar images. [1] [2]
The result is a view of landscape structure that an optical camera above the clouds cannot provide. It shows craters, ridges, channels, plains and volcanic landforms. Its brightness nevertheless follows radar scattering, rather than the visible colour of rocks. Reading it like a sunlit landscape photograph can therefore lead to the wrong interpretation. [1] [2]
Why one slope looks brighter
A rough surface can scatter a stronger radar echo back toward the spacecraft than a smoother one. Slopes facing the radar may also appear bright. The response depends on the wavelength and on the ground’s electrical properties as well as its shape. Dark terrain is not automatically lower, cooler or younger than bright terrain. [1]
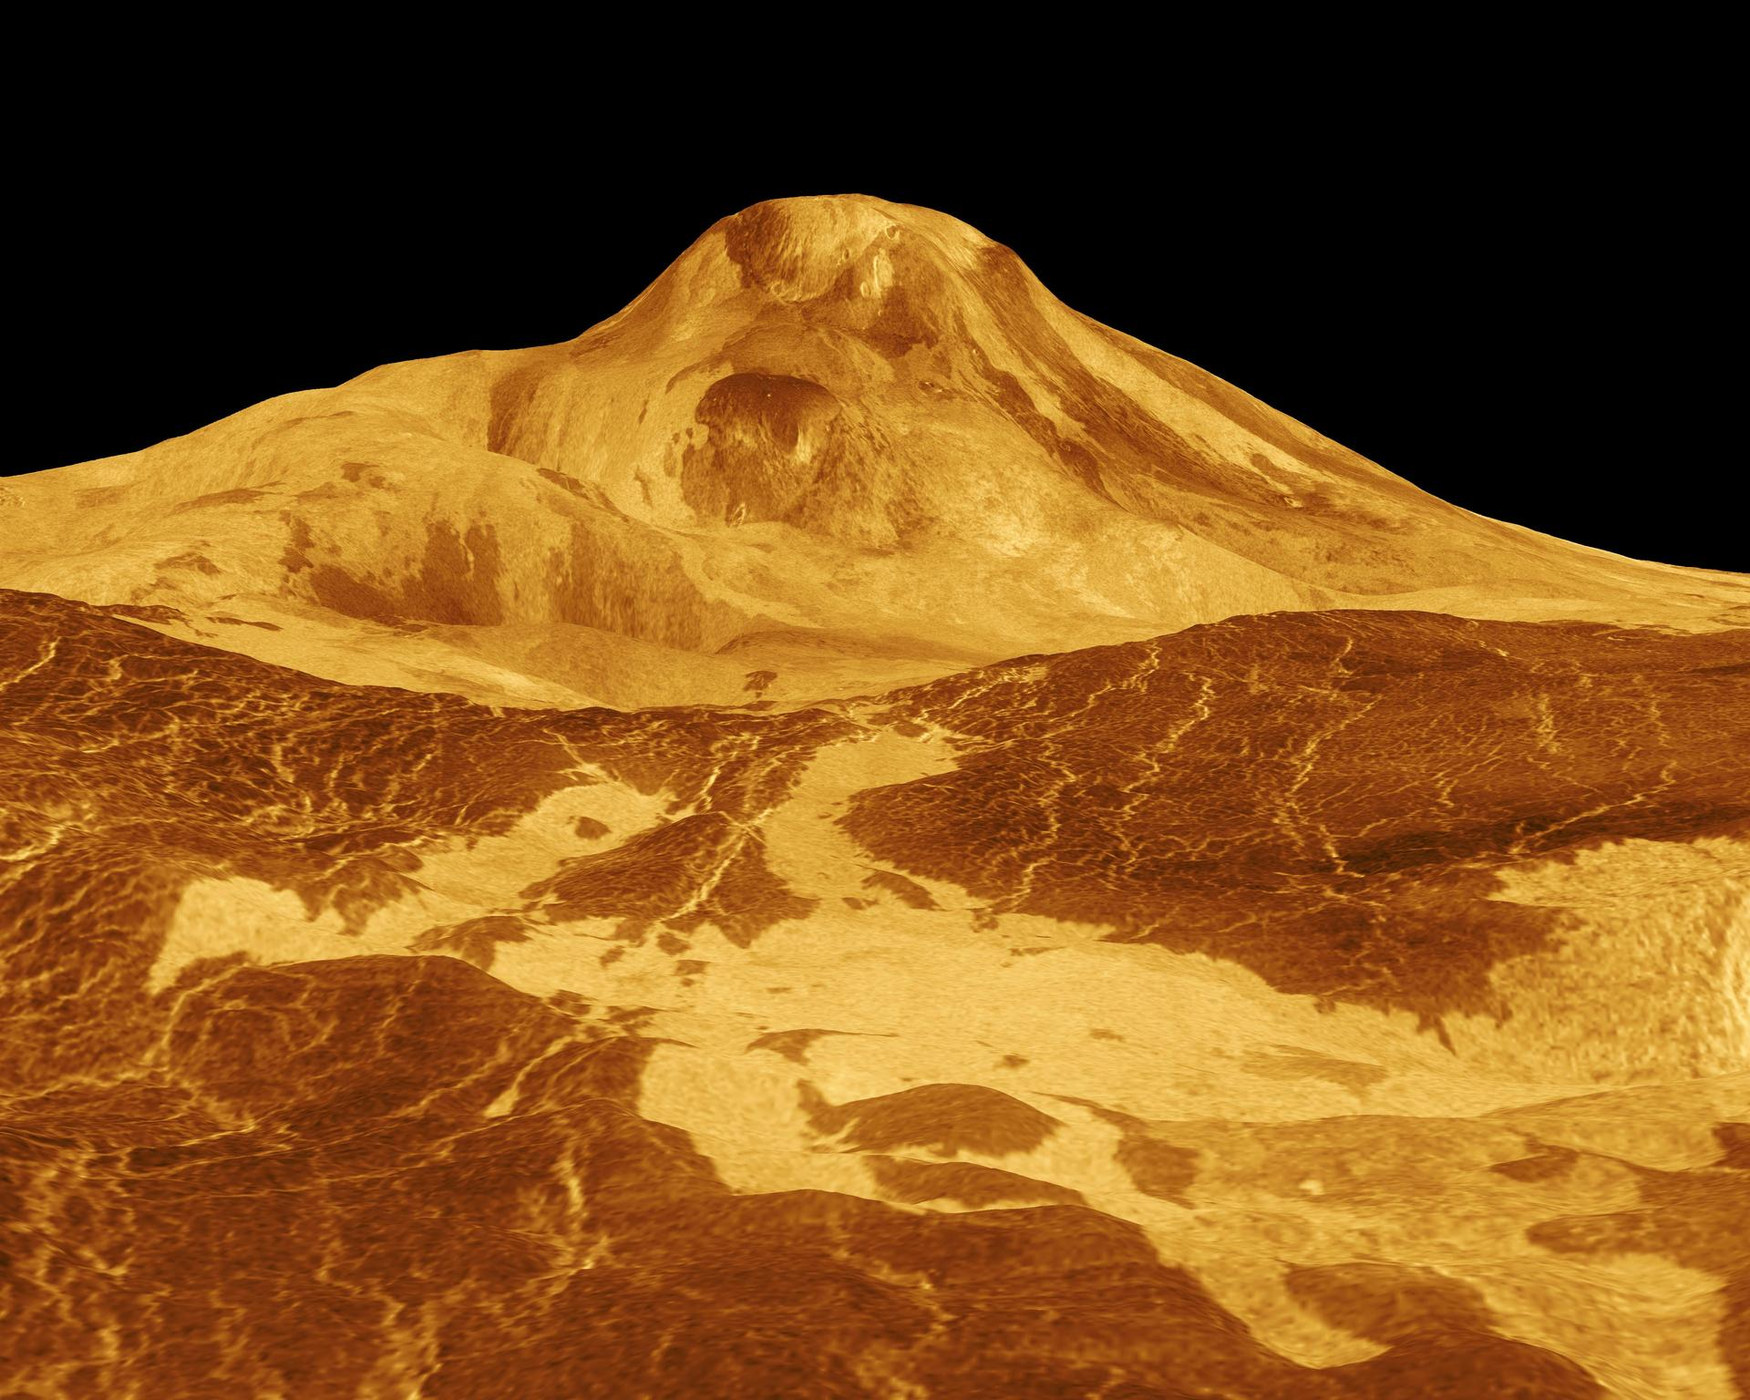
Viewing geometry can stretch or compress apparent features. To interpret a boundary, compare the radar direction and available elevation measurements. A perspective rendering that combines radar imagery with topography is another constructed product. It can reveal relief clearly, provided its processing and any vertical exaggeration are retained in the caption. [1]
Look for changes on the same volcano
Researchers revisited Magellan observations acquired months apart in 1991 and identified changes in a volcanic vent on Maat Mons. Its shape and apparent size differed between the observations. Interpreting those changes required modelling how the different viewing angles would affect an unchanged feature before considering a physical change. [3]
That is the essential test for repeat imaging. The instrument, geometry or processing can change a picture even when the landscape stays still. Only after those alternatives have been examined can a difference become evidence of activity. The Maat Mons analysis supports an interpretation involving volcanic change during the Magellan era. [3]
An archive can answer a new question
A separate analysis published in 2024 identified radar-brightness changes consistent with new lava flows in two other regions. It used the same mission archive to investigate a different spatial signature: changes extending across terrain rather than only the shape of one vent. Multiple independent sites strengthen the case for active volcanism. [4]
Neither result is a live eruption alert. The observations date to Magellan’s mapping campaign. Their significance is that Venus’s surface was changing within the interval sampled by those images. More repeated mapping can determine where activity happens, how often it occurs and how much material is moved—questions a single global mosaic cannot settle. [4]
Sources & image credits
Related reading and objects
Why Venus holds its heat
Magellan mapped a rocky world hidden beneath Venus’s clouds. At the ground, temperatures are around 465°C—hotter than on Mercury. The explanation depends on where energy leaves Venus, as well as how much sunlight arrives.
Why Venus’s clouds outrun the planet
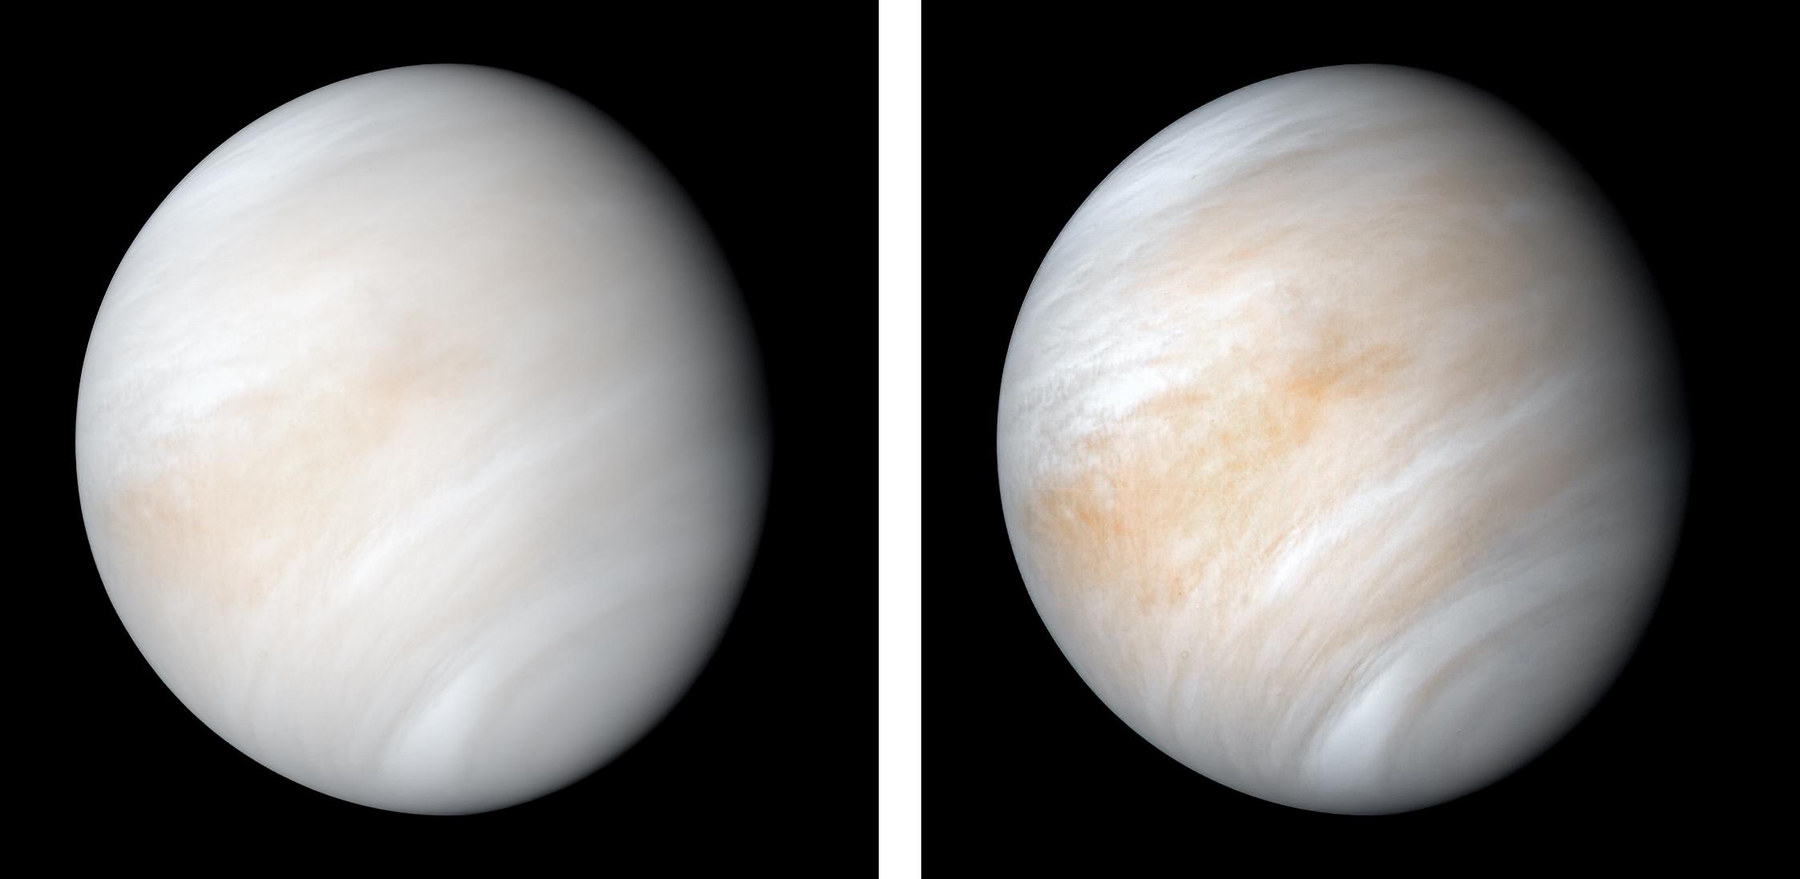
Akatsuki observed Venus at ultraviolet and infrared wavelengths to follow weather at different heights. Its target was a striking mismatch: the solid planet takes about 243 Earth days to rotate, while winds near the cloud tops can circle it in only a few days.