

Northern lights tonight: what makes a forecast worth acting on?
An aurora forecast can put an oval near you and still leave you under a blank sky. Read the map’s time, the darkness and your actual horizon together. Then use a simple Earth-curvature experiment to see why the glow need not be overhead.
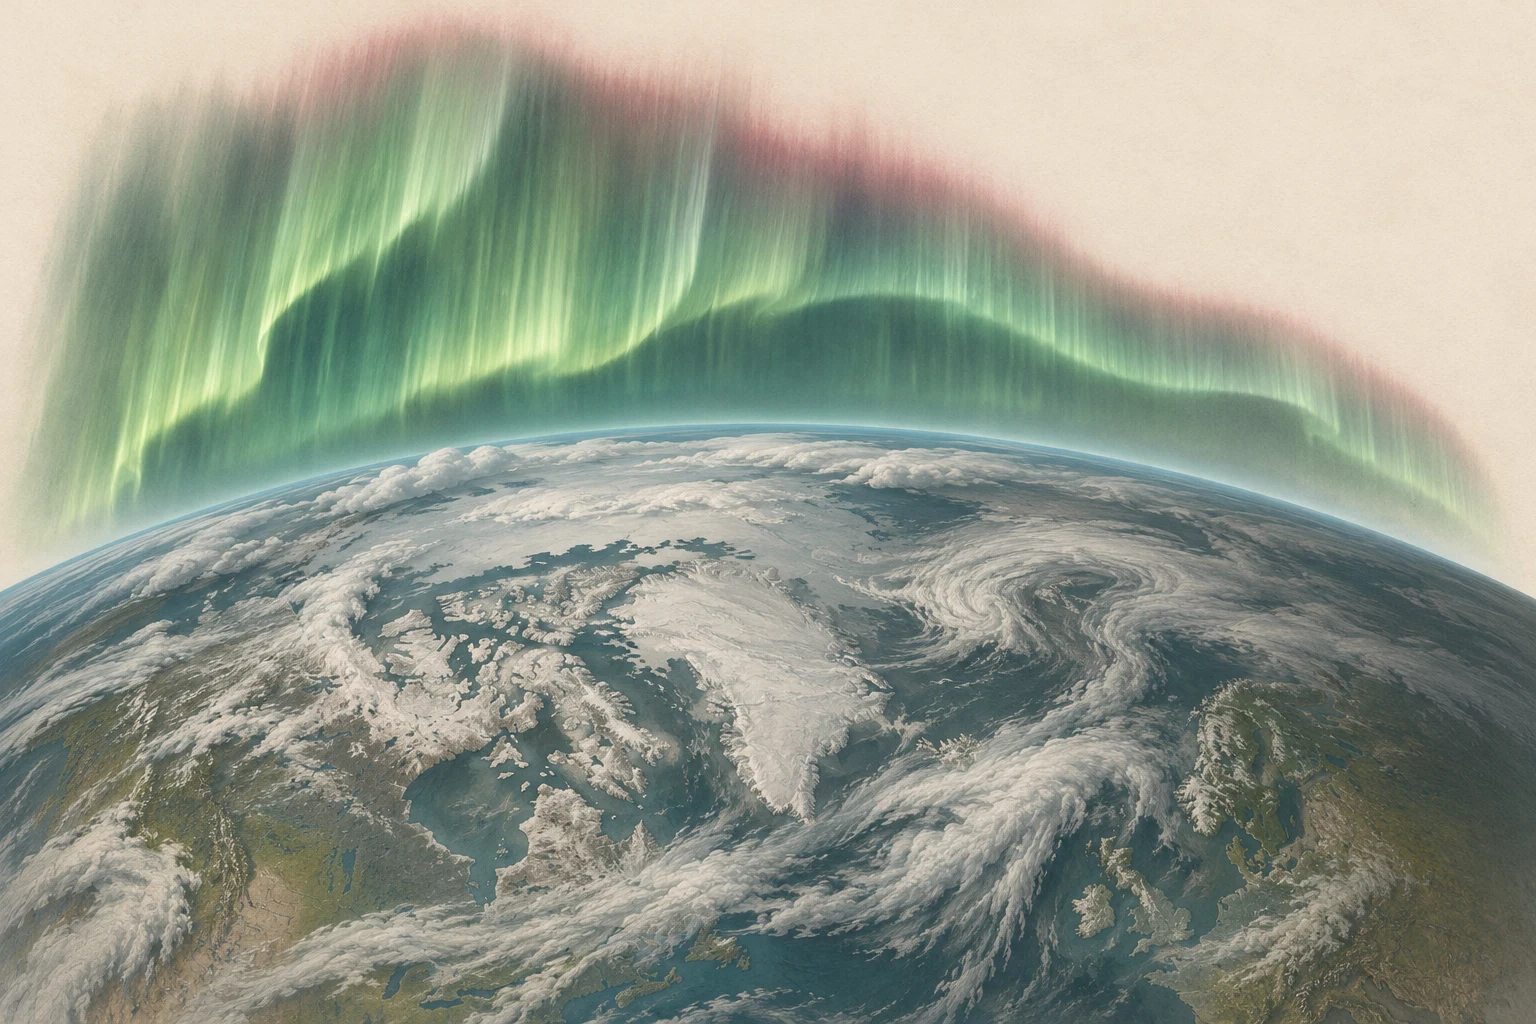
First read the time, then the coloured oval
NOAA’s short-term OVATION product combines upstream solar-wind measurements with an empirical aurora model. Its map estimates where auroral emission is likely to occur and how intense it may be. The coloured oval is an emitting region above Earth; a location outside its brightest colour can still have a view toward it. [1]
Open the latest product and read its observation and forecast timestamps. A screenshot shared earlier in the evening can describe an earlier solar-wind condition. The button below checks that NOAA’s grid is recent before loading its northern map; the full NOAA page also provides the southern map and the product explanation.
Next check whether your location is dark and whether the relevant part of your sky is clear. A strong emitting region in daylight, or behind an opaque cloud bank, does not become visible because its colour on the map is vivid. [1] [2]
How far away can an aurora still be above your horizon?
Move the emitting layer away from the observer. Earth’s curvature changes its apparent height.
- Above the geometric horizon
- 10.1°
- Surface distance at the horizon
- 1,175 km
Where the calculation stops
The sphere has a 6,371 km radius. The calculation omits refraction, mountains, brightness and clouds. A visible geometric path does not establish that an aurora is bright enough to see.
Check the current NOAA product
Load NOAA’s latest northern-hemisphere map, then check your local darkness and weather.
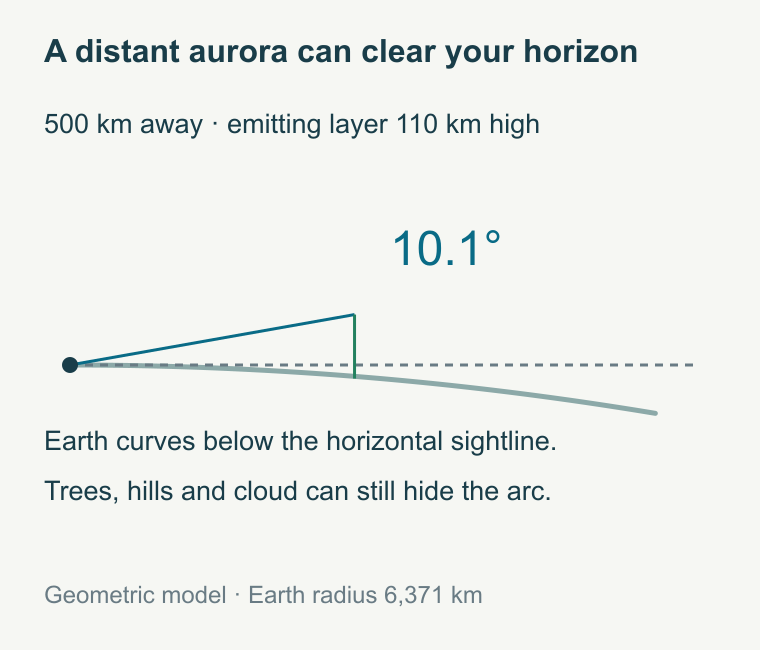
Enable JavaScript to explore the model.
The oval can be far away while its light remains in view
Imagine a luminous layer 110 kilometres above the ground, 500 kilometres away along Earth’s surface. On a spherical Earth with radius 6,371 kilometres, the sightline reaches it about 10.1° above the observer’s geometric horizon. That is low enough for a tree line or ridge to matter, yet high enough to be visible over an open horizon.
Increase the distance in the experiment. Eventually Earth’s curvature hides the chosen layer. Raise the layer and the horizon distance grows. NOAA describes auroral emission across a broad altitude range, roughly 80–500 kilometres, so different parts of a display can have different visibility geometry. [3]
This explains why checking an open horizon can matter as much as standing directly under the forecast oval. It also explains the limit: the calculation has no brightness, atmospheric extinction or cloud model. A positive elevation is a possible sightline, not a measured chance of seeing a display.
Kp is a global disturbance index, not your personal probability
Kp runs from 0 to 9 and summarizes geomagnetic disturbance. Higher values can accompany an auroral oval extending farther toward lower magnetic latitudes. NOAA uses it as a broad planning aid. It does not measure the cloud over your house, the brightness of a particular arc or what your eyes will see in the next five minutes. [2]
Location tables need particular care: magnetic latitude and ordinary geographic latitude are different coordinates. Copying your city’s geographic latitude into a magnetic-latitude threshold can give a misleading answer. Use an actual forecast map and your local sky conditions to refine the broad Kp signal.
Even the forecast product can change its basis. NOAA says that contaminated or missing upstream solar-wind data can force OVATION to use a Kp-based estimate. In that mode the product has no upstream forecast lead time. The label “30-minute forecast” is not an unconditional promise that every frame predicts half an hour ahead. [1]
Why the useful warning is often short
Spacecraft near the Sun–Earth L1 region sample solar wind before it reaches Earth. In a simple distance-over-speed example, 1.5 million kilometres at 400 kilometres per second takes 62.5 minutes. Faster flow reduces that travel time. This gives a physical reason for a useful warning measured in tens of minutes rather than a precise schedule days ahead.
NOAA describes its normal short-term aurora forecast as roughly 30–90 minutes ahead. The incoming magnetic field matters along with speed, and the magnetosphere’s response is more complex than a parcel moving down a pipe. The simple travel-time calculation explains the scale; it cannot determine a local display. [1]
For a view of the incoming conditions, NOAA’s real-time solar-wind page is the primary reference. The spacecraft feeding a live operational product can change, so check that page’s current status instead of assuming an old guide’s named satellite is still the sole source. [4]
A magnetic disturbance becomes light in the upper atmosphere
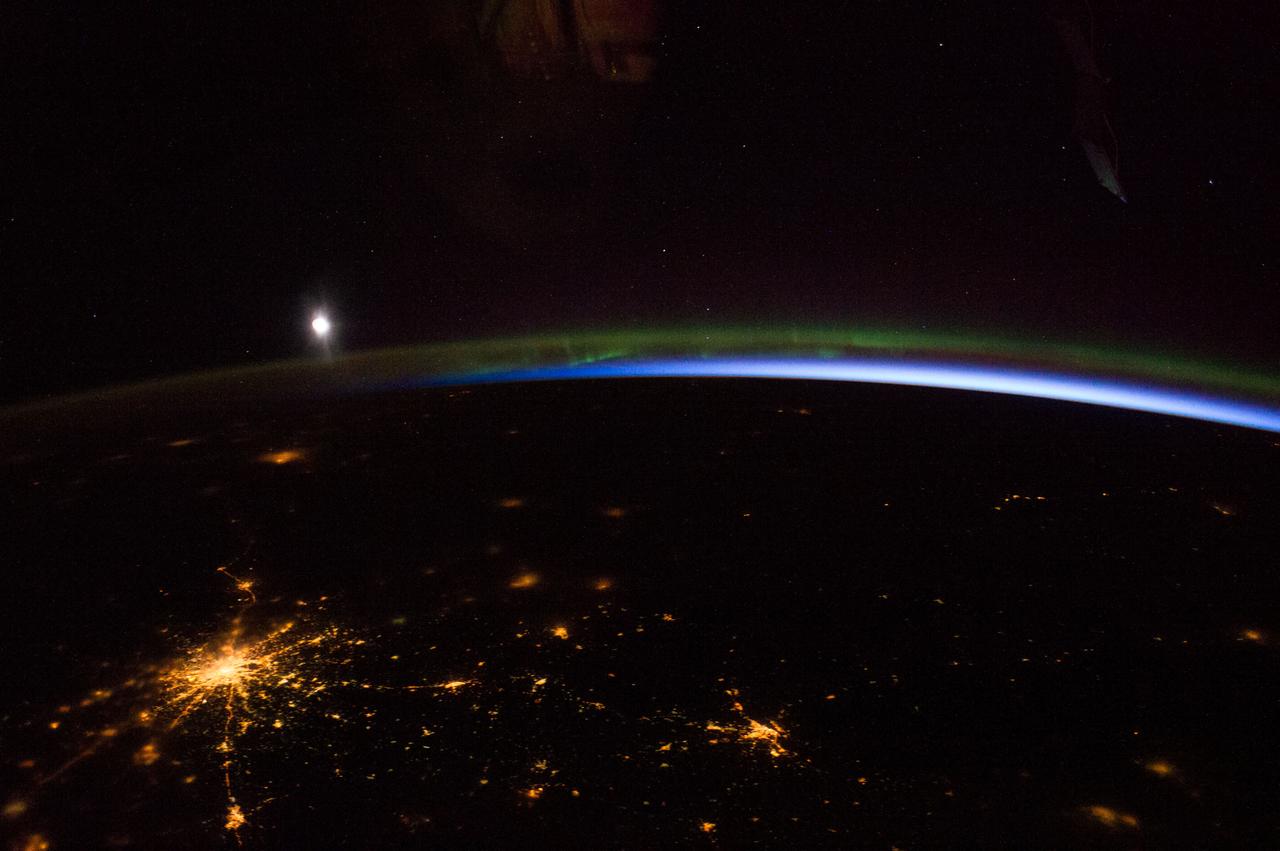
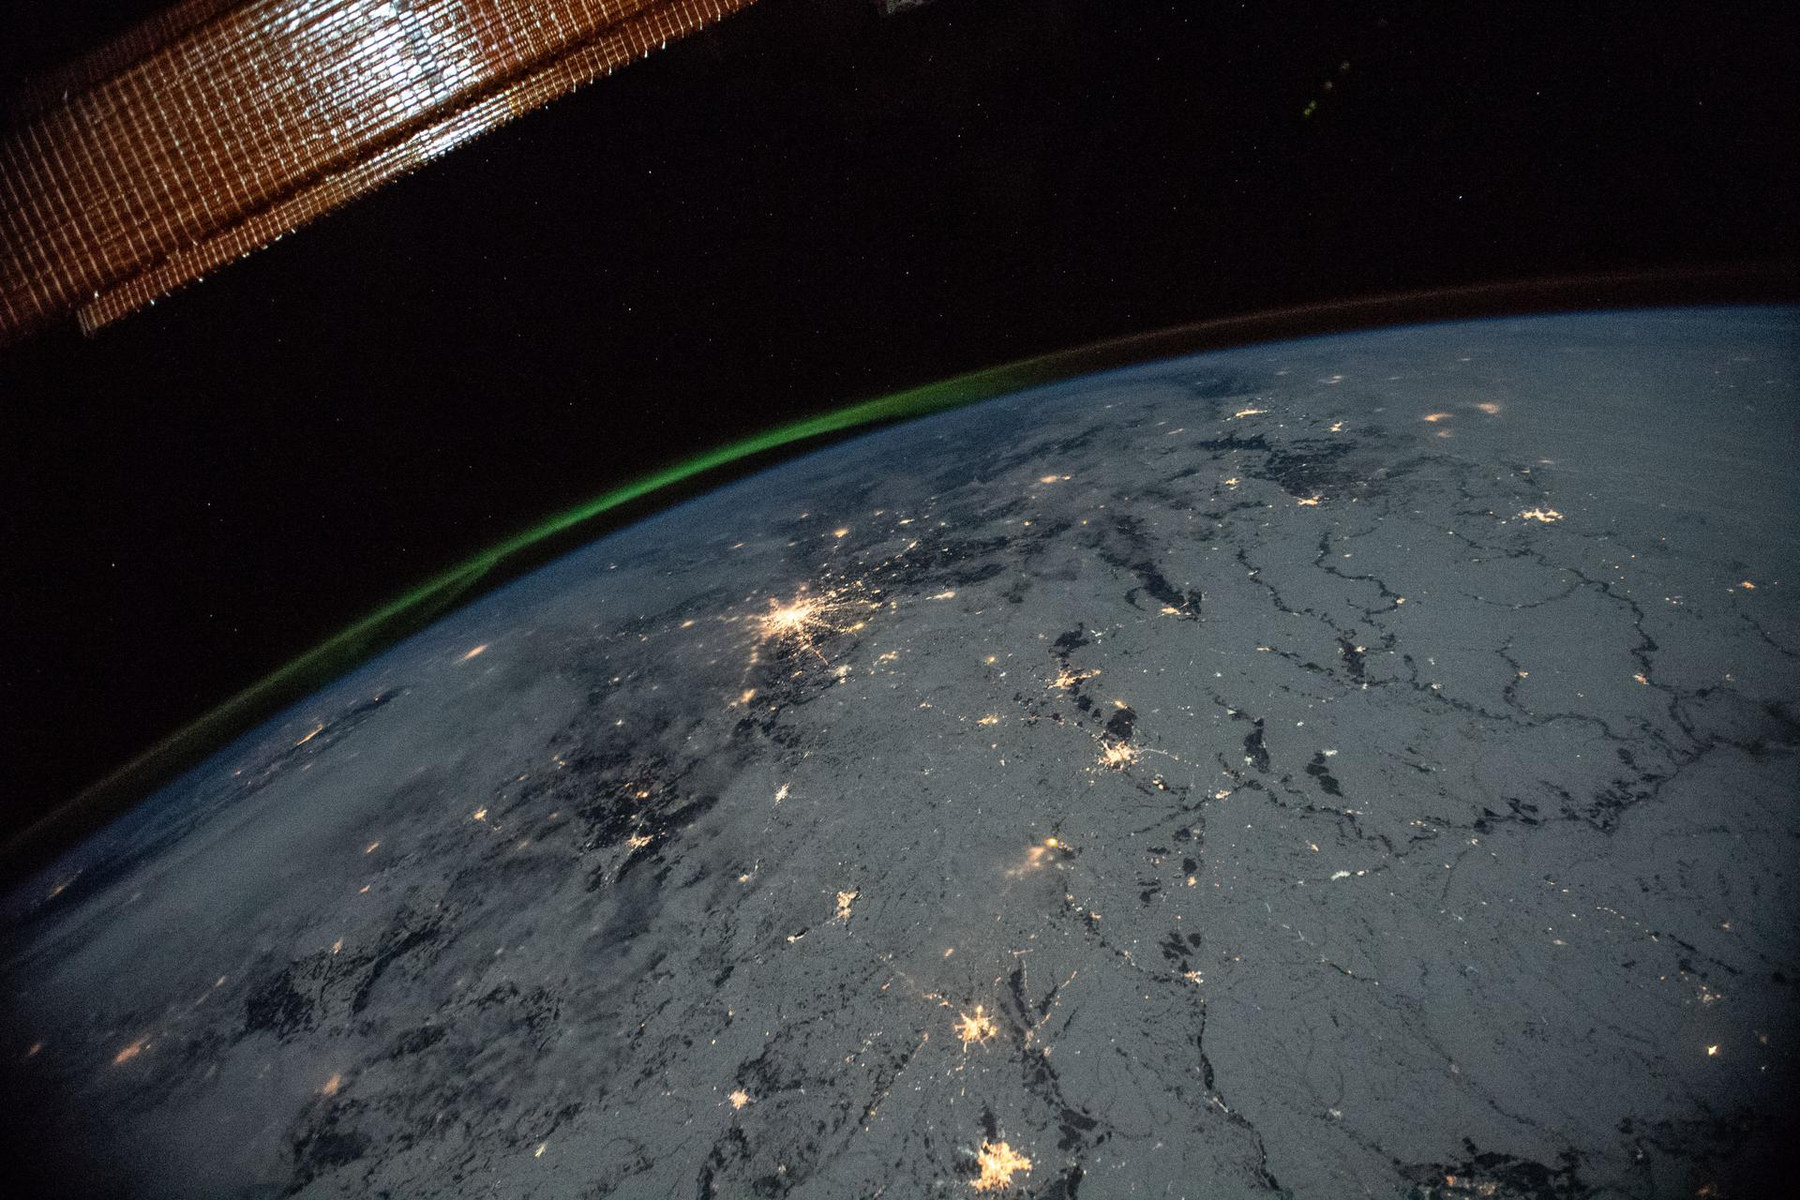
Auroral light is emitted when energetic particles interact with the upper atmosphere. Excited oxygen and nitrogen release energy as light, producing colours at different heights and under different conditions. The glow is above ordinary weather clouds, which is why cloud can hide it from the ground while an orbital photograph shows it clearly. [3] [6]
The curtain in the opening illustration makes that vertical separation visible. The station photograph shows a real limb view. Neither replaces the live product: one explains the arrangement, and the other records a particular display in 2014.
Make the next decision from the next observation
For a possible outing tonight, check the current NOAA map, the forecast time and a local cloud forecast. Pick a dark site with an open view toward the auroral oval. At many northern mid-latitude locations that means a clear northern horizon; if the oval moves overhead, look across more of the sky. Give your eyes time to adjust. [2]
Use longer-range outlooks to decide whether to keep the evening free, then reassess with short-term measurements before travelling. NOAA’s tonight-and-tomorrow product uses a different forecast window from the short-term map, and its page records the removal of the old viewline in May 2026. A copied boundary from an older article can therefore be the wrong tool. [5]
A useful forecast changes a decision: whether the sky is promising enough to step outside, where the open horizon is, and when to check again. The coloured oval supplies one part of that decision. Darkness, cloud and your sightline supply the rest.
Sources & image credits
Related reading and objects
The Leonids after the peak
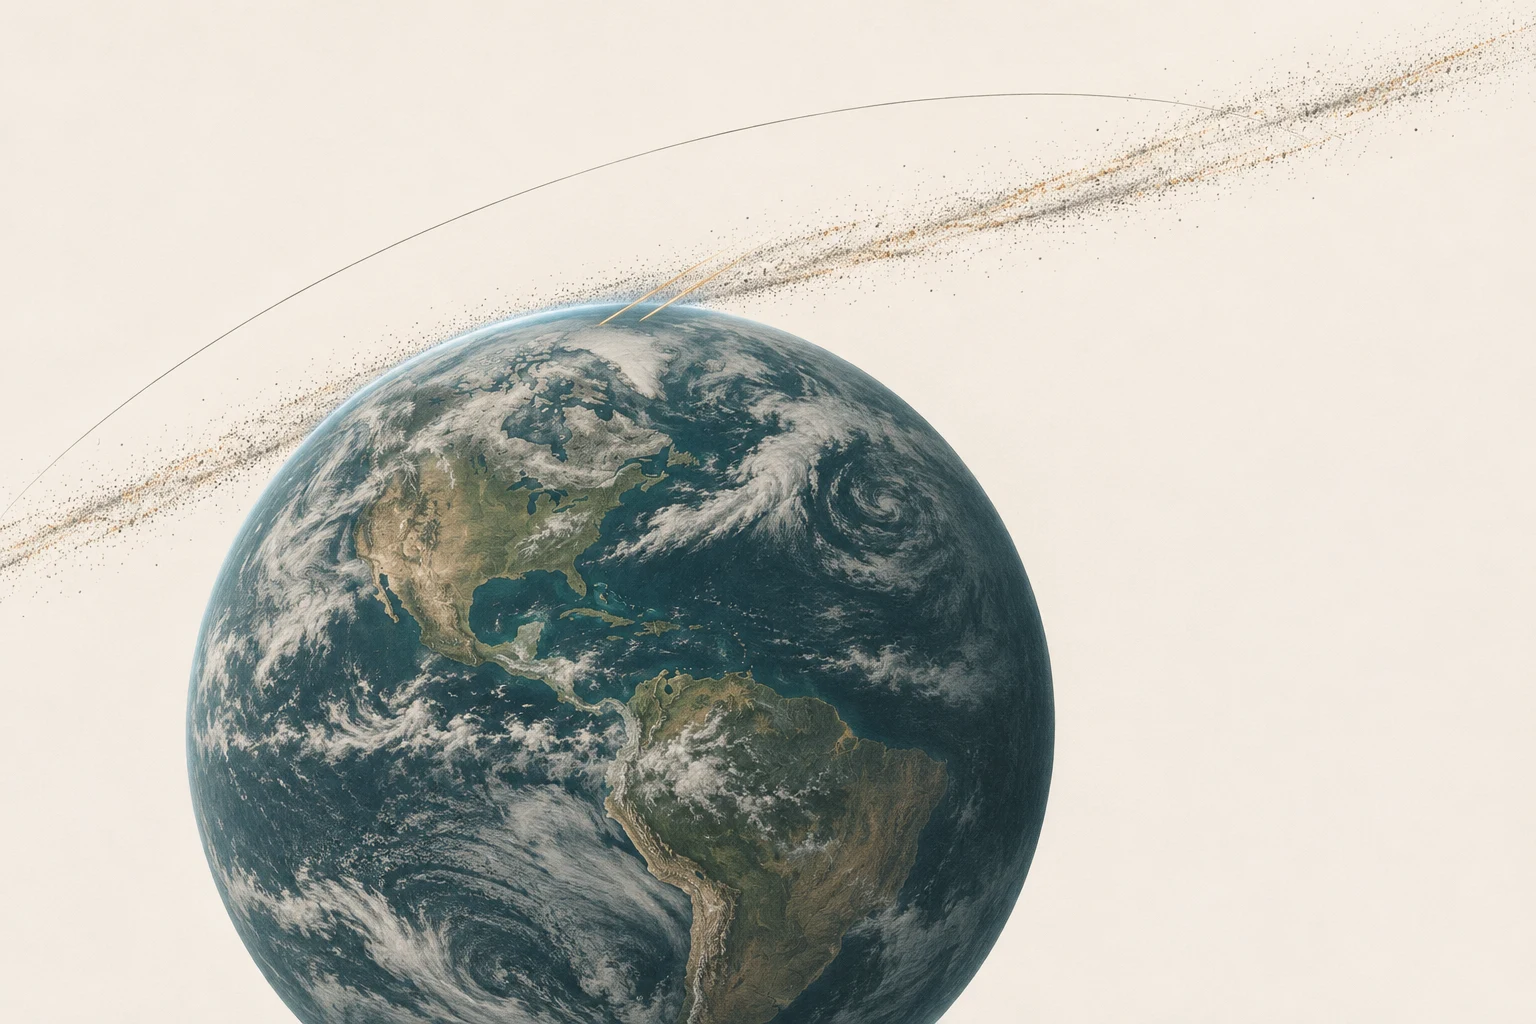
Can you still see the 2026 Leonid meteor shower? Yes. On the night of November 18–19, try the last dark hour before morning twilight. In London, 3 a.m. GMT on Thursday, November 19 is one workable hour: Leo’s radiant is about 42° up and the Moon is below the horizon. Check cloud before you set an alarm.
Reading Earth’s magnetic field from orbit
ESA launched three Swarm satellites to measure a field made mostly thousands of kilometres beneath our feet. Their instruments also detect magnetised rocks, currents in space and even moving seawater. To understand Earth’s magnetic field, they must separate those signals.