

Inside spaceflight / 08How things work
A rocket can get faster after Max Q
Griffin-1 is preparing for a Falcon Heavy journey to the Moon. Before the vacuum, its launcher must cross an atmosphere where getting faster and finding thinner air pull dynamic pressure in opposite directions.
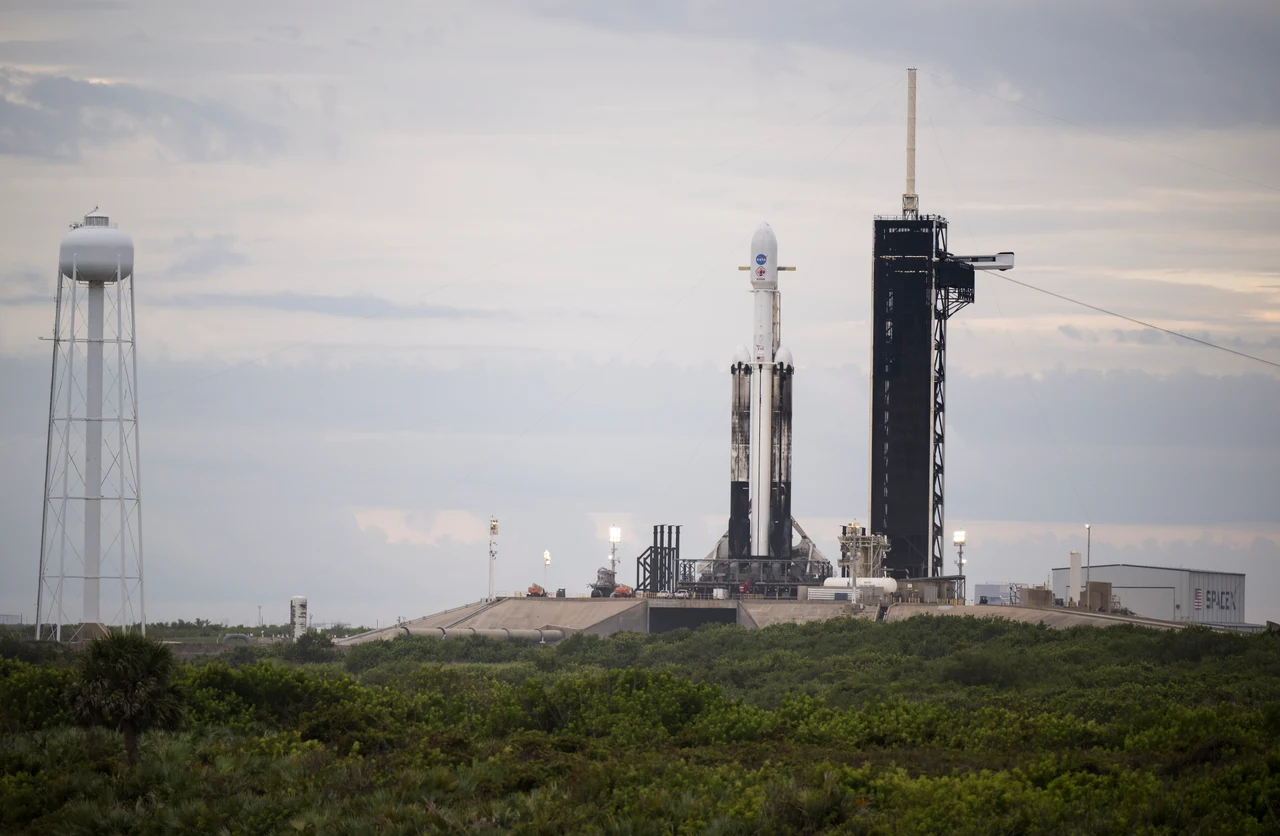
The Moon journey begins in air
NASA targets late 2026 for Griffin-1, a lunar lander assigned to a Falcon Heavy flight toward the Moon’s south-pole region. Its ground-test campaign has finished, but the launch remains ahead. One part of that future journey will happen before the spacecraft reaches space: the launcher must climb through Earth’s atmosphere. [1] [2]

A historical Falcon Heavy flight supplies a useful reference. On 13 October 2023, NASA reported that the rocket carrying Psyche had passed Max Q before side-booster separation. That callout described an atmospheric milestone. It did not mean the rocket had reached its highest speed, entered orbit or completed its job. [3]
The photographs here separate those events carefully. The Falcon Heavy on the pad and in flight carried Psyche in 2023. They do not show Griffin’s future launch. The connection is the verified launcher assignment, not a prediction that Griffin will follow the same timing or trajectory. [4] [5] [1]
Two inputs, one pressure scale
Aerodynamicists define dynamic pressure as q = ½ρv². The symbol ρ is the surrounding air density; v is speed relative to the air. Use kilograms per cubic metre and metres per second, and q comes out in pascals. Ground speed alone is insufficient because wind changes the relative flow the vehicle encounters. [6]
The two inputs do different things. At fixed speed, halving density halves q. At fixed density, doubling speed multiplies q by four. During ascent, speed generally rises while the air becomes less dense. Dynamic pressure depends on their combined evolution, so a speed increase does not settle the question on its own. [6] [7]
The name pressure can be misleading if it is taken to mean a uniform extra squeeze on every surface. Dynamic pressure is a useful scale for the moving airflow. The actual pressure distribution and forces depend on how the flow meets the vehicle. The definition remains useful for compressible flow; it does not make the simple incompressible Bernoulli relation valid everywhere around a fast rocket. [6] [8]
A faster case can have less dynamic pressure
Take three deliberately chosen examples, with no rocket or altitude assigned. At 1.2 kg/m³ and 100 m/s, q is 6,000 Pa. Now reduce density to 0.3 kg/m³ and double speed to 200 m/s. The density is one-quarter as large and speed squared is four times as large, so the two changes cancel: q is still 6,000 Pa. [6] [7]
Faster does not always mean higher pressure
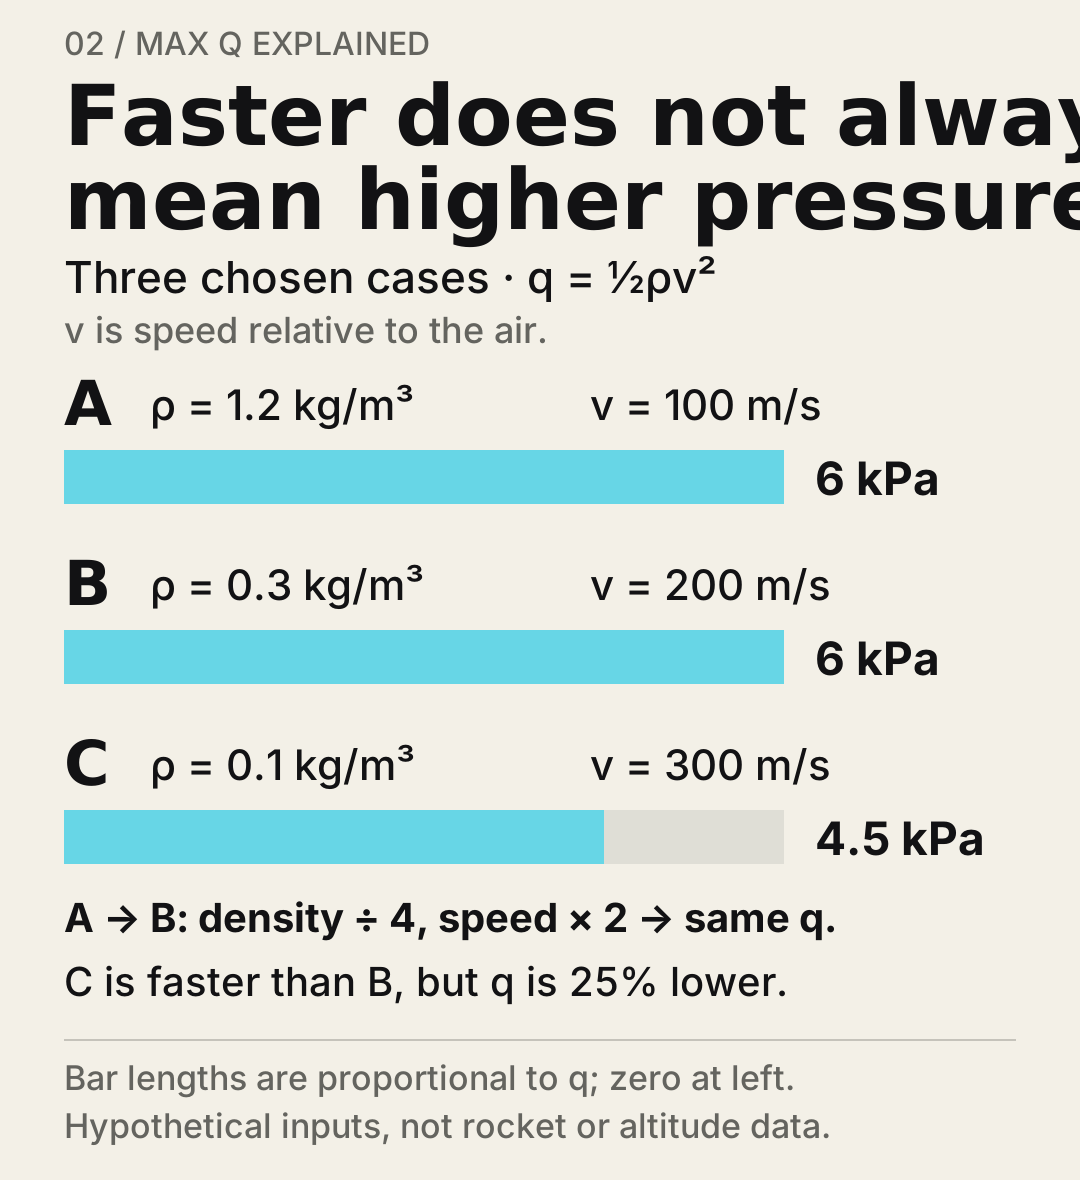
Three hypothetical input pairs, calculated from q = ½ρv². The pressure bars use a common linear scale. No mission telemetry or altitude is implied.
- A: ½ × 1.2 kg/m³ × (100 m/s)² = 6,000 Pa.
- B: ½ × 0.3 kg/m³ × (200 m/s)² = 6,000 Pa.
- C: ½ × 0.1 kg/m³ × (300 m/s)² = 4,500 Pa.
Original Spacian illustration · [6] [7] Download diagram ↗
For a third case, choose 0.1 kg/m³ and 300 m/s. The calculation gives 4,500 Pa. This case is faster than either of the first two, yet its dynamic pressure is lower. These numbers demonstrate the equation; they are not measurements, an atmospheric profile or an estimate of Griffin’s Max Q. [6]
A peak is a balance, not a special speed
Imagine following a rising rocket through successive moments. Early on, increasing speed can outweigh the loss of density, making q rise. Later, sufficiently rapid thinning can outweigh the speed increase, making q fall. At the peak, those opposing fractional changes balance. There is no universal speed, altitude or second after liftoff at which every vehicle reaches that balance. [6] [7]
Max Q comes before the highest speed
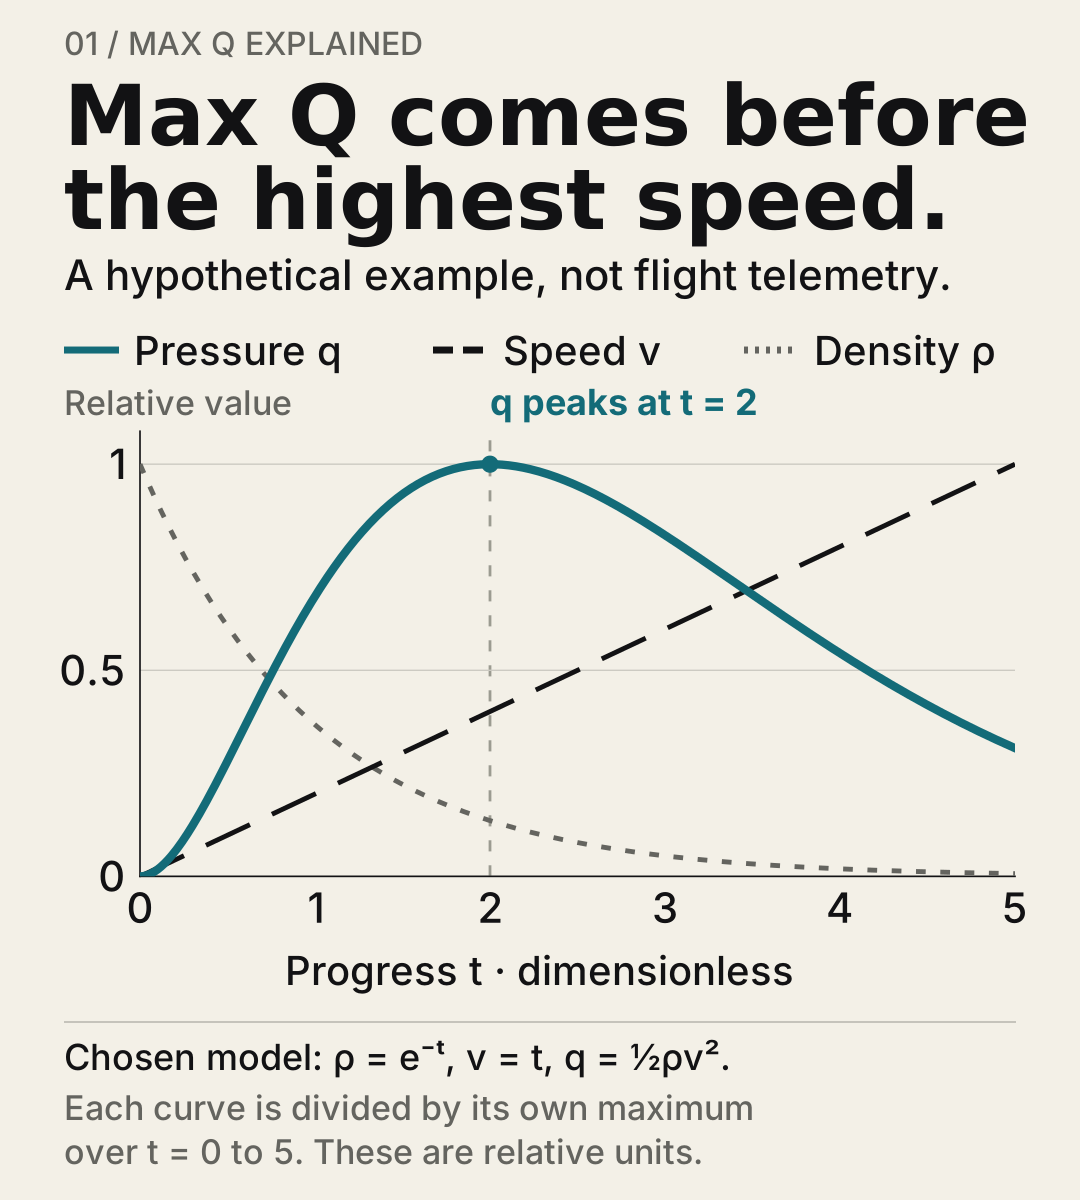
Chosen dimensionless model, not flight data. Independently normalized curves show why a pressure maximum need not be the fastest point.
- Density falls as e⁻ᵗ in this chosen model, while speed rises as t.
- The derivative dq/dt = ½e⁻ᵗt(2−t) changes from positive to negative at t = 2.
- Independent normalization shows when each quantity changes; it does not equate their physical sizes or units.
Original Spacian illustration · [6] [7] Download diagram ↗
The figure uses a transparent mathematical teaching choice: density falls as e⁻ᵗ, speed rises as t, and t is dimensionless progress from zero to five. Substituting those choices into the definition gives q = ½e⁻ᵗt². Its pressure curve peaks at t = 2 even though speed keeps rising. The model illustrates the competing trends; it does not simulate a launch. [6]
Each plotted curve is divided by its own maximum over the displayed interval. That makes their changing shapes readable together, but it does not put density, speed and pressure into the same physical unit. The vertical scale compares relative progression within each quantity, not their absolute sizes. [6]
The peak in the chosen model
Differentiating q = ½e⁻ᵗt² gives dq/dt = ½e⁻ᵗt(2−t). For positive t, the slope changes from positive to negative at t = 2. This checks the plotted peak; the model’s exponential density and linear speed are teaching assumptions. [6]
Pressure is not the whole load
To turn a pressure scale into a drag force, another relationship is needed: D = qCᴅA. Here A is the chosen reference area and Cᴅ is the drag coefficient defined for that area. Shape, inclination to the flow and flow conditions affect the coefficient. A quoted q value alone therefore does not specify the force on every different vehicle. [8] [9]
Same pressure. Different drag force.
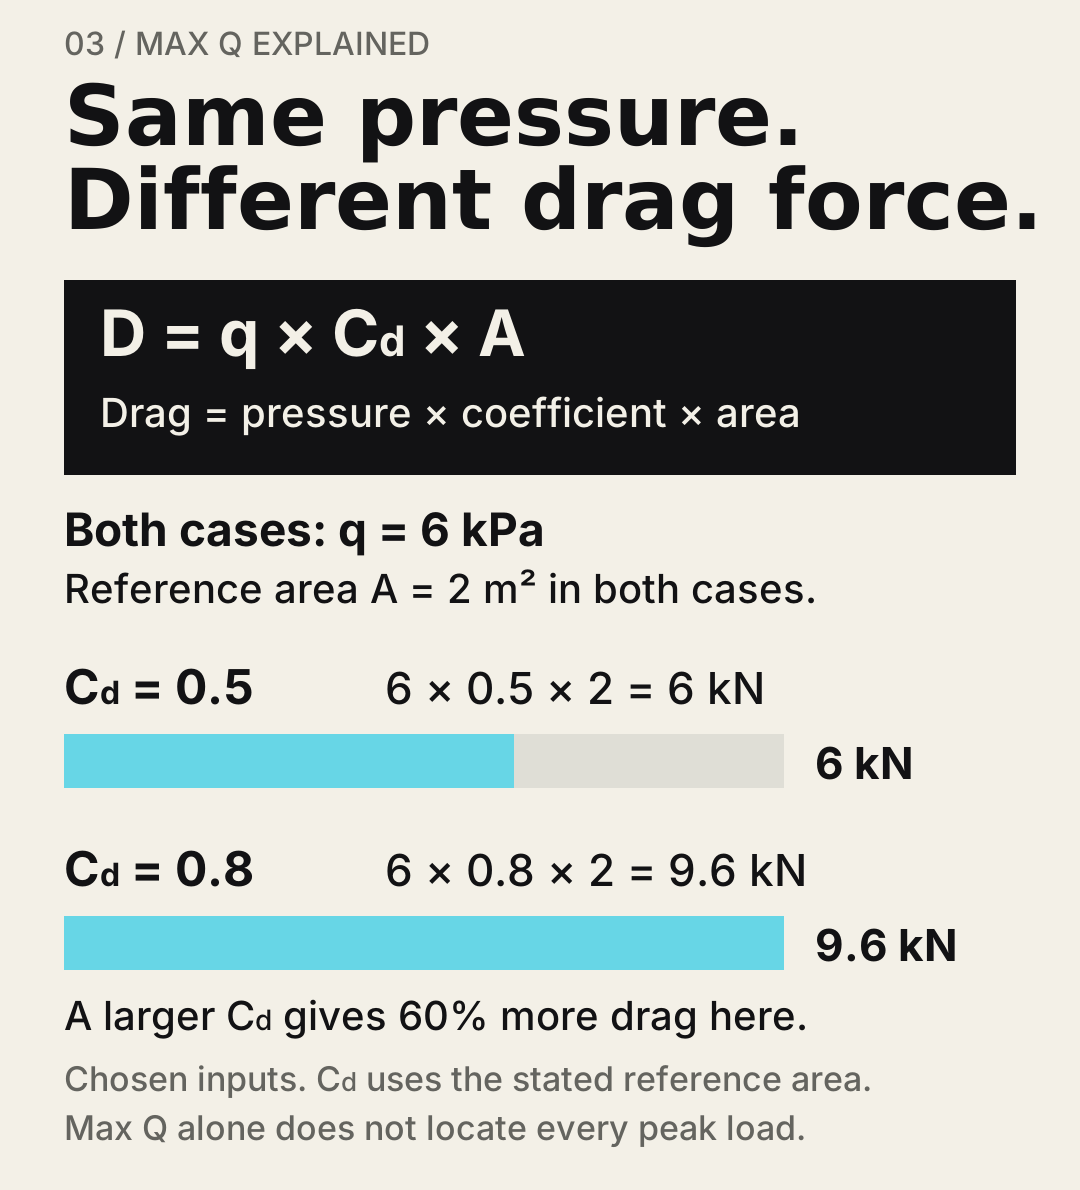
Two chosen coefficient cases at the same pressure and area. The drag bars preserve the 6:9.6 force ratio; the example is not a vehicle specification.
- D = q Cd A; Cd is dimensionless and is defined using the stated reference area.
- 6 kPa × 0.5 × 2 m² = 6 kN.
- 6 kPa × 0.8 × 2 m² = 9.6 kN, 60% greater drag.
Original Spacian illustration · [8] [9] Download diagram ↗
Use another explicit teaching example. With q = 6 kPa and a reference area of 2 m², a coefficient of 0.5 gives 6 kN of drag. Change the coefficient to 0.8 at the same q and area, and the drag becomes 9.6 kN. Nothing in this example assigns either coefficient or area to Falcon Heavy. [8] [9]

Wind-tunnel work helps engineers investigate these dependencies. NASA’s 2016 image shows an SLS scale model used for ascent testing, including a pressure-sensitive paint technique. It is a different rocket. Its useful lesson is the method: examine how flow loads a particular shape instead of treating one scalar pressure as a complete structural answer. [10] [9]
What the launch callout leaves open
Max Q identifies the maximum of the dynamic-pressure curve being discussed. It is useful because aerodynamic forces scale with q, but other changing factors still matter. It should not be promoted into a claim that every load has peaked or that the rest of the flight is risk-free. A coefficient can change while q changes, and a new flight phase creates a different engineering problem. [8] [9]
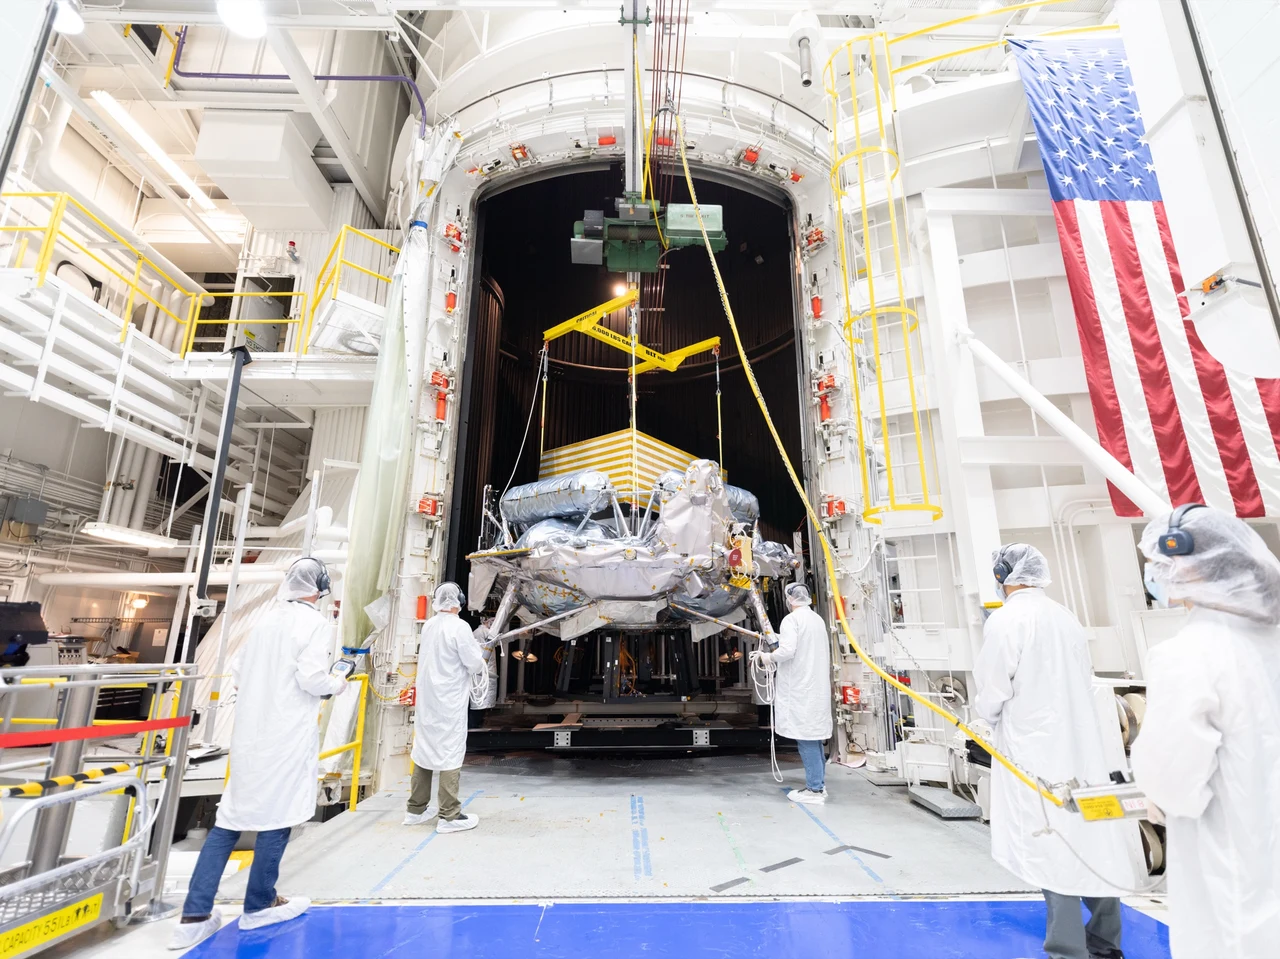
It is also distinct from the ground tests Griffin has already completed. Sound, mechanical shaking, electronics compatibility and thermal-vacuum testing address separate conditions. An environmental-test result is not a measured Max Q for a flight that has yet to happen. [2]
For Griffin’s upcoming mission, the honest expectation is that Falcon Heavy must take the lander through air before it can send it onward. The exact ascent profile belongs to the actual flight plan. When the callout comes, it will describe a pressure milestone—not the fastest possible moment and not the end of the journey. [1] [6]
Read the evidence
Sources & image credits
- NASA · Voyager Griffin-1 mission, late 2026 target ↗
- NASA/JPL · Griffin environmental testing, 13 October 2026 ↗
- NASA · Psyche Falcon Heavy passes Max Q, 13 October 2023 ↗
- NASA · Psyche ready to launch, October 2023 ↗
- NASA · Psyche launch, 13 October 2023 ↗
- NASA Glenn · Dynamic pressure ↗
- NASA Glenn · Density effects ↗
- NASA Glenn · Drag equation ↗
- NASA Glenn · Drag coefficient ↗
- NASA Ames · SLS wind-tunnel testing, published 22 December 2016 ↗
Technical explanation by Spacian, reviewed against the linked sources. Photographs retain their original dates, creators and reuse terms in their captions. Original diagrams explain mechanisms and do not reproduce engineering drawings or flight telemetry. Editorial policy and corrections.
Continue the story
Follow the mechanism
 How things work
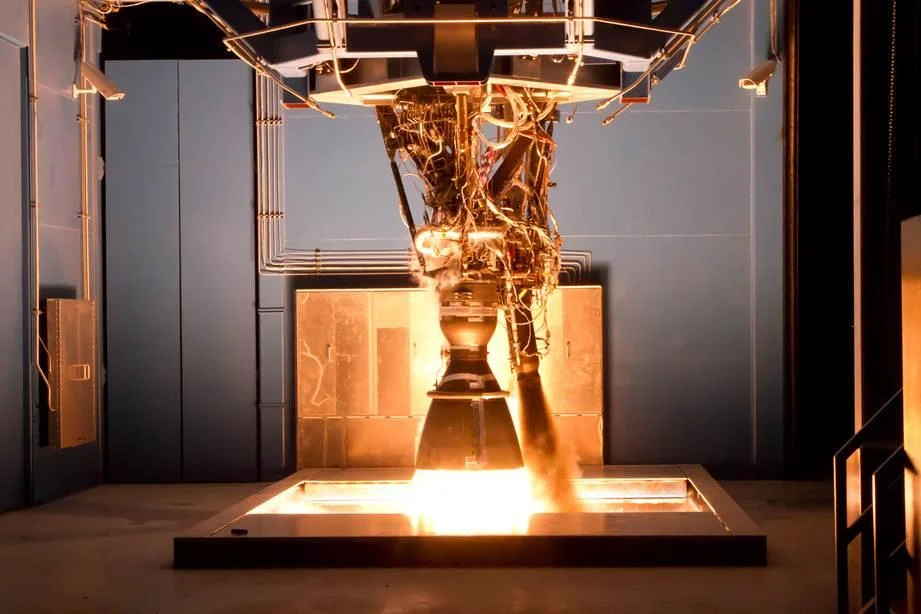
From liquid to liftoff.
Follow fuel, oxidizer and exhaust through a rocket engine, and discover why it works in empty space, how the nozzle makes thrust and what the pumps do.
Read the explanation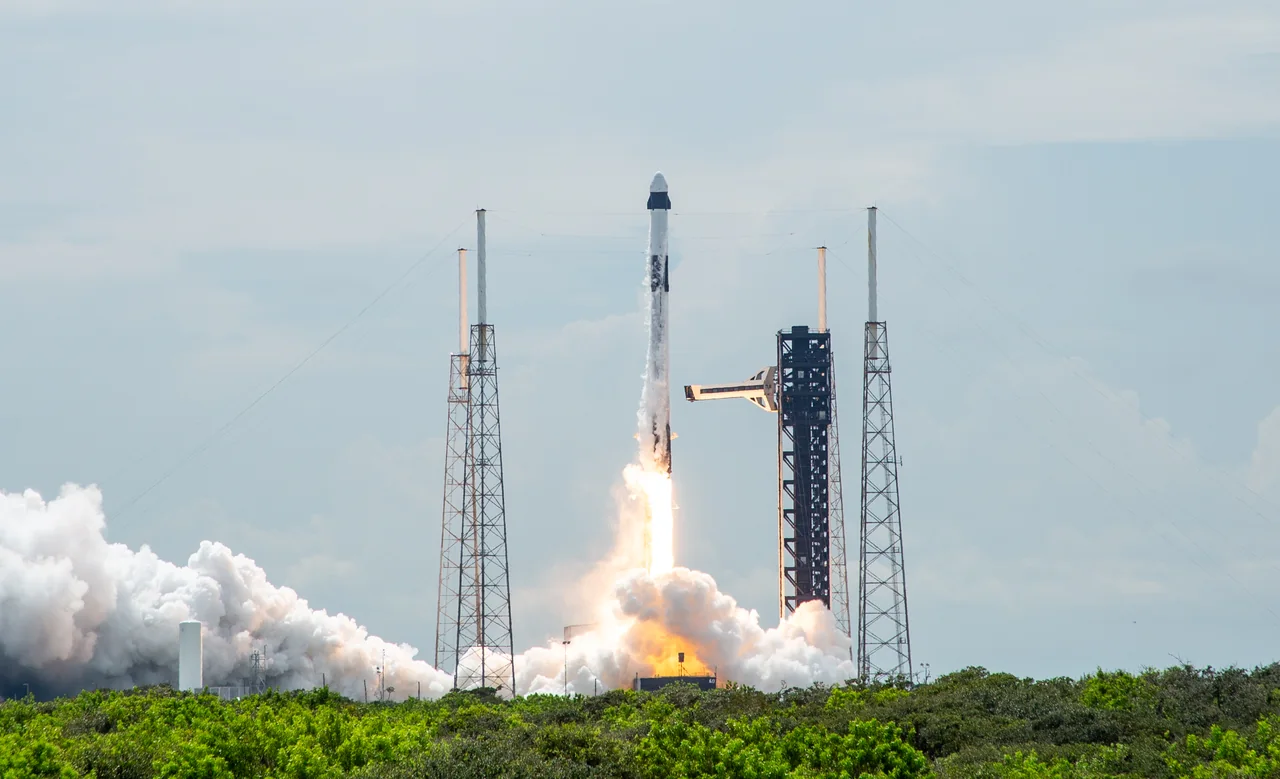 Rocket anatomy
One rocket. Two different flights.
Explore Falcon 9’s Merlin engines, two stages, payloads and booster recovery, with photographs and diagrams that explain how the flight fits together.
Read the explanation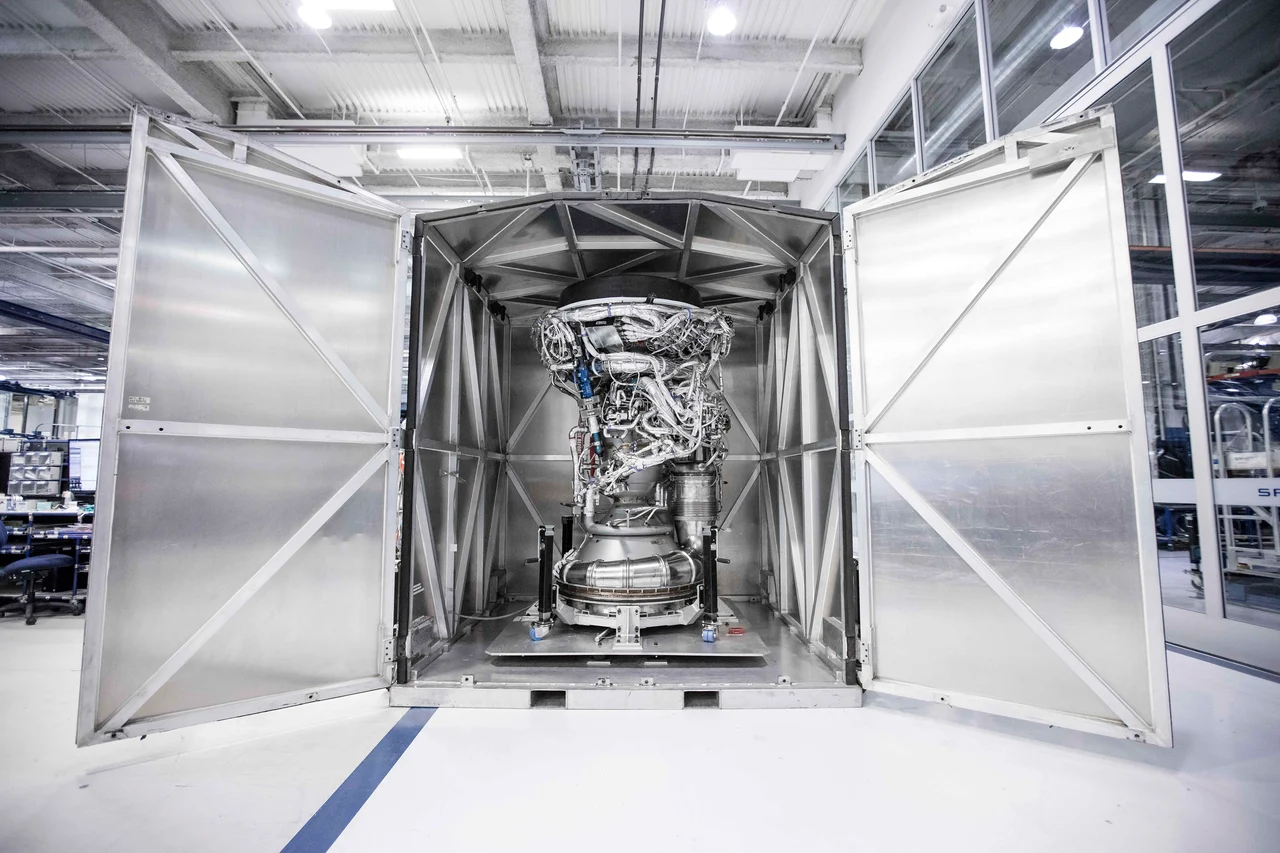 How things work
Build the bell for space.
Discover how a rocket nozzle turns hot gas into speed, why vacuum engines use large bells and how outside pressure changes the design problem near the ground.
Read the explanation